ForexAlgo is a powerful trading signal app designed for Forex traders, offering precise signals for Forex pairs. Enjoy a 3-day free trial to experience its accuracy and effectiveness. Available on both iOS and Android, ForexAlgo empowers traders with timely insights.
George Douglass Taylor thoroughly studied the markets and developed a sophisticated strategy for trading them. His method has been handed down over the generations as the "Taylor Trading Technique" and is widely recognized as one of the most solid fundamental old school trading approaches.
Become a full access member to all of thei exciting services. Membership includes: Trade room access, software activation for up two computers, and thei Daily Market Movers trade reports.
A trend resembles a wind: it has both direction and strength. ninZa.co researched and developed Nova Wynd as a lag-free indicator purely based on ATR and price action without moving averages or smoothing. Get it today and start seeing which way the wind blows!
edgeful breaks down market data into easy to read reports that instantly show you how any asset behaves, down to a specific weekday. They have all the breakdowns to tell traders when to size into a trade, when to size down, and even where to set your profit targets, based on the data, not opinions."
Professional-grade, lightning-fast trading system that self-adjusts to the current volatility conditions as it trades the re-emergence of momentum on modern financial markets. Available in standalone and Bloodhound versions. Built rock-solid for NT8.
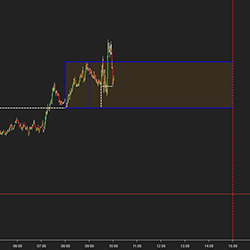
Add the visual benefit of displaying the session open value (settable). Build a visual range of any timeframe you choose. For example, the first 30 minutes of the market open or an hour before the market opens. Choose the end time for a range to stop displaying for the day.
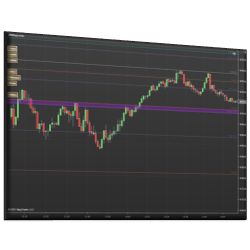
This indicator tracks the Smart Money flow in the market. Following the Smart Money provides a better understanding of the volatility size and trend direction. Ready to see what the Smart Money is doing?
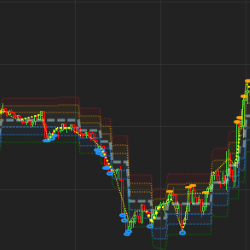
The Key Levels Confluence Indicator calculates various daily levels and combines them into powerful zones where price action is likely to respond in the future. Daily levels include the Open, High, Low and Close (OHLC) of past days, Fibonacci Levels, Whole Numbers, Current Day Levels and Pivots.
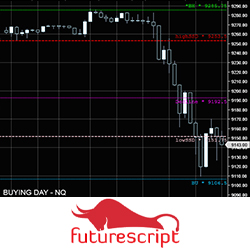
Free Discord EdsRetracePlan with Markers Plus CHAT. Using a single indicator and Range charts, you can automate CL, NQ and GC trade entries by turning on Markers Plus. Trades will be taken using the ERP long or short signals. Talk in the free Discord chat about how easy it is to trade with ERP & MP.
December 2, 2024
Mastering Sideways Markets With Auction Bars and Range Projections
November 19, 2024
Enhancing Your Automated Trading System: Key Insights from Best Pro Trade
November 14, 2024
NinjaTrader New Ecosystem Tools: October 2024 Edition
Enter Email for Updates