The Volatility Index (VIX) is a real-time market index that represents the market's expectation of 30-day forward-looking volatility. The VIX moves inversely to the indices and is often used as an indicator of upcoming market moves to time precise entries and exits. AKA Fear Gauge or Fear Index
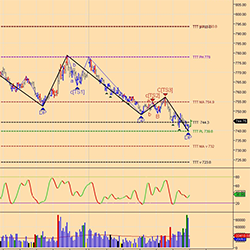
The TTT Lines Indicator extracts the information from the daily TTT E-Book report & plots the data directly on NinjaTrader charts. Quickly identify the TTT support and resistance levels plus more!
Precision Volume Trading High Volume Indicator lets you know where the volume is being traded to trade with high liquidity.
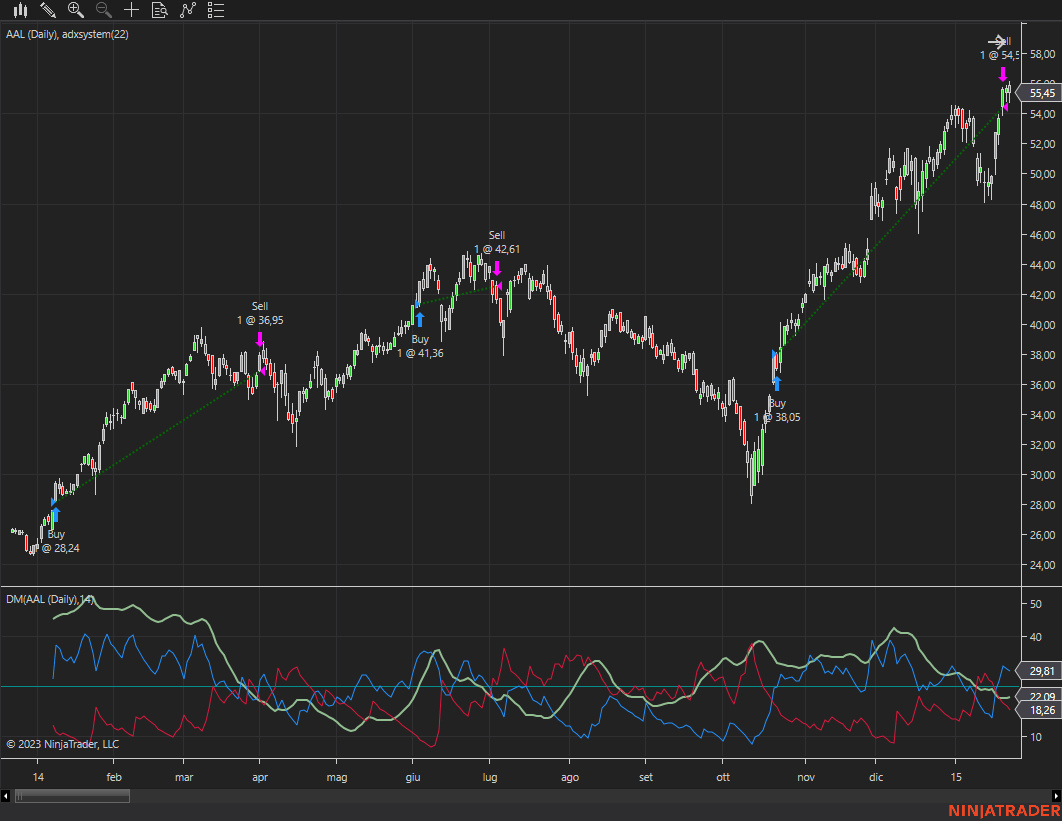
ADX trading system detecting price direction as well as trend strength.
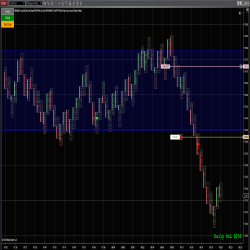
The Breakout Blitz is a full user and discretion controlled tool for traders, built by traders. Available on Ninjatrader 8, this tool can help eliminate your range trading, sitting and waiting dilemma. Once you identify a range, place your breakout box over, choose your direction and go!
Trading OrderFlow delivers your ideas: your imagined automated strategy, semi-automated strategy or custom indicator. Turn your concept into an elegant solution adapted to your trading style and needs. Contact them about your development project for specialized service and expertise!
You can download and try our best free indicators for NinjaTrader 8 now! These indicators are free for life. 24-hour technical support. Watch video tutorials on indicator details and how to use them. Hurry! Click here to download and use now!
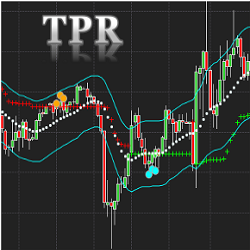
The Trend Pullback Reversal (TPR) Indicator displays possible price trends with pullback and reversal signals. TPR will focus on the main trend and filter out most minor price movements. The NinjaTrader 8 version comes with a unique band and center line as additional features.
Epic Follow measures an instrument’s correlation to another instrument and, if a big movement is made, triggers a trade. Strategy optimization (templates provided) provide trade setups based on historical performance. It is multi-timeframe and supports futures, equities, and crypto! Download trial!
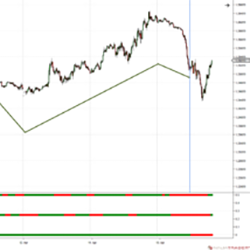
The EnlightCoders HeadScalper gives you market direction with a traffic light plot – red or green. SAT (Scalp Auto Trend) is a versatile and self-adapting tool to identify what is happening in the big picture. It reduces noise with smart filters and shows just one thing: the trend in red or green.
December 2, 2024
Mastering Sideways Markets With Auction Bars and Range Projections
November 19, 2024
Enhancing Your Automated Trading System: Key Insights from Best Pro Trade
November 14, 2024
NinjaTrader New Ecosystem Tools: October 2024 Edition
Enter Email for Updates