Toni Hansen is uniquely positioned to share over two decade’s worth of trading secrets, methodologies and financial strategies with clients in this highly interactive and market-focused learning environment.
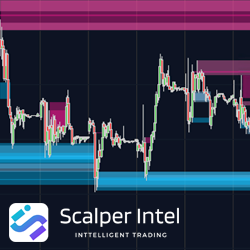
Elevate your trading strategy with the Volume Levels Indicator. Detecting support and resistance from volume, it delivers precise levels respected by the price. Features include order flow cumulative delta integration, real-time order block detection, an age counter for significance tracking & more.
Our intelligent and powerful automated strategies let you rule the markets like a pro. Algos are available for most popular futures markets and are ready to go out of the box. Our strategies are NinjaTrader 7 & NinjaTrader 8 compatible to take your trading to the next level.
Fully-automated. The VMX selects a time of day to trade during the cash session for stock index futures. This system takes advantage of the volatility created by big institutions moving asset allocations in the equity markets. All positions closed before the end of the cash session.
The Ichimoku Mentoring Program contains 4 weeks of pre-workshop webinars, a live 2-day boot camp, 2 months of post course mentoring, access to the trade room & Ichimoku research center. Learn more!
Try our fully-functional, ready-to-use automated trading strategy for NinjaTrader 8 at no cost for 14 days. Designed for the futures market, it has been thoroughly backtested, needs no adjustments, & is suitable for Micro/Mini markets. Full support and templates are included during your free trial.
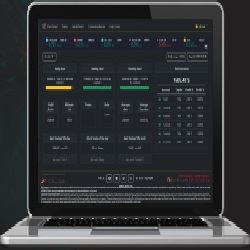
The best risk management dashboard tool, with an intuitive web platform that provides complete control, protection & detailed visualization of the evolution of all trading accounts. Optimized for propfirm trading, our solution is the ultimate choice for traders and teams. Click to learn more!
Daily Levels plots important levels such as prior days open/high/low/mid/close, overnight high/low/mid, IB high/low and more! It also displays historical probabilities of price touching each level in regular and overnight sessions for the most popular futures products.
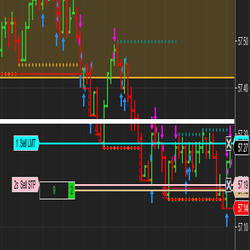
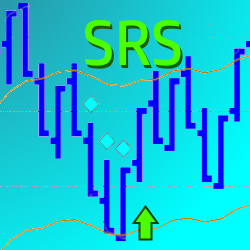
This indicator paints entry signals on pullbacks and allows the trader to avoid sideways market conditions. It includes a filter to only paint signals if there is also a Stochastics overbought/oversold condition. Click here to view examples and try today!
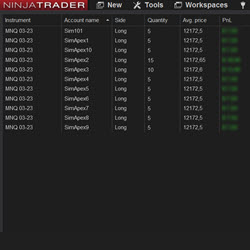
With this tool you can copy your own trades to multiple accounts from the same broker. If you use Propfirms with multiple accounts this is a must have for you. You can trade up to 20 accounts, open orders between different instruments, and have the possibility for an order multiplier.
December 2, 2024
Mastering Sideways Markets With Auction Bars and Range Projections
November 19, 2024
Enhancing Your Automated Trading System: Key Insights from Best Pro Trade
November 14, 2024
NinjaTrader New Ecosystem Tools: October 2024 Edition
Enter Email for Updates