edgeful breaks down market data into easy to read reports that instantly show you how any asset behaves, down to a specific weekday. They have all the breakdowns to tell traders when to size into a trade, when to size down, and even where to set your profit targets, based on the data, not opinions."
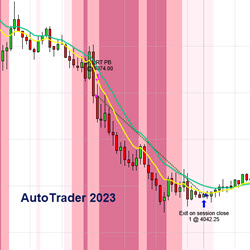
The AutoTrader 2023 system offers automated trading strategies, covering a broad range of trading risk profiles; indicators, backgrounds and a powerful money management module to protect profit and principal are also included. Lease includes training and support.
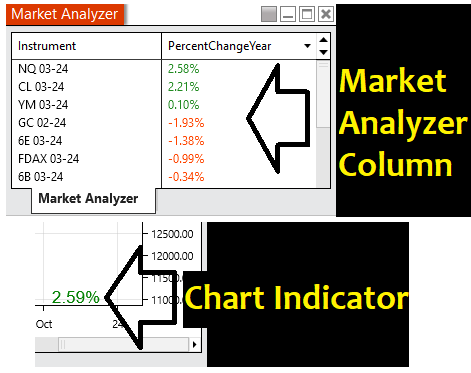
Easily display an instrument’s percent change on the year, on your market analyzer or chart. Works with stocks, futures or indices. Watch markets bounce off key figures like 8%, etc. Free Indicator.
Prove you have what it takes to make money and we may fund you as a trader! We did it ourselves, we’ve done it for others, and we know we can help you, too. Learn. Get Funded. Trade! Come take the TradeDay Evaluation Challenge and get funded as a trader with our capital in live markets.
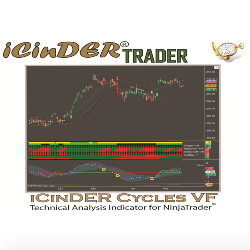
The iCinDER™ Cycles VF (Velocity Force) indicators allow for a quick validation of analysis, thus speeding up reaction time to market movement's bias. The analysis is based on velocity force of the instrument being analyzed.
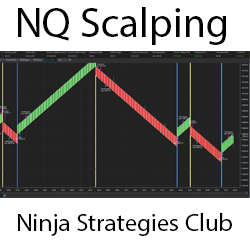
Open-source code can be developed. If you want, you can add different strategies on it. Lifetime free updates. Take-profit at three, five or seven ticks, stop-loss at 13 ticks. Change the take-profit and stop-loss settings.
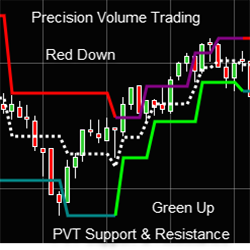
Precision Volume Trading Support & Resistance measures each swing point for traders to know where buyers and sellers are.
YMI University is designed to pack the utmost essential content into one trading course. It's designed to give you a new level of understanding of how the stock market works, how to get started, and how you can utilize your abilities to excel and grow.
Price action in relation to volume. Studying these variables establishes the equilibrium of supply and demand, as well as the possible near-term direction of the market. Don't just measure volume - measure volume that can anticipate a potential change in trader sentiment!
Unlock the power of Wyckoff VSA through an optimized package that uses SMART Technology to generate easy-to-use live alerts and preset approaches. Save 80% charting time with SMART Technology. Four easy-to-implement, rules-based strategies. SMART audible notifications for signals and setups.
December 2, 2024
Mastering Sideways Markets With Auction Bars and Range Projections
November 19, 2024
Enhancing Your Automated Trading System: Key Insights from Best Pro Trade
November 14, 2024
NinjaTrader New Ecosystem Tools: October 2024 Edition
Enter Email for Updates