Toni Hansen’s most popular online trading course is now available as a boot camp! Originally developed by Toni in the late 90s, her straightforward trading methodology has withstood the test of time.
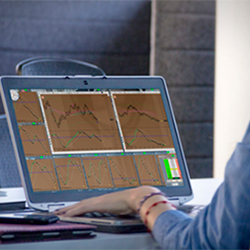
E-Mini Tutor offers three 1 on 1 Day Trading Education options aimed at traders who are interested in understanding the markets. The Pivot based trading methodologies strive to forecast market moves before they occur empowering traders to work smart, not hard. Enroll today!
The AVALON Strategy is a relaxed long-term End-of-Day (EOD) trading strategy for the Futures Market. It requires minimal effort and is ideal for traders who like to take it easy and keep things as stress free as possible. Test the AVALON Performance now with the Online Backtester!
Virtual Private Server (VPS) technology provided by your hosting provider lies at the core of NinjaTrader VPS options. For instance, this service, offered at an affordable price with a guarantee of premium speed and reliability, is available through the expertise of AvaHost.
The SRM App is an automated risk-management solution that solves 16 common trading problems; overtrading, over-leveraging & emotional decision-making. Prevent costly errors by solving problems in real-time.
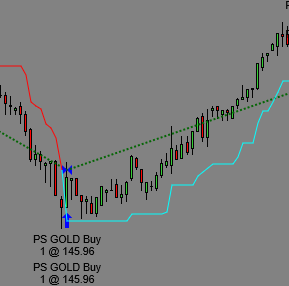
Latency protection is built in to protect you during fast moves. Trend following technologically advanced product with a complex algorithm that adjusts stop distance. SAR type operation. Not to be confused with other SARs that don't change trend until the bar closes. This does it in real time.
ChartVPS provides high-end virtual private servers (VPS) to traders, enabling them to automate strategies & securely trade from any device, anywhere 24/7. Our servers & network are built specifically for trading & NT platform, ensuring compatibility, ultra-low latency & smooth operation.
The ultimate semi-auto trading strategy that harnesses the power of a premier indicator, Peaks. This innovative tool gets you into trades, automatically as a signal is generated, eliminating the need for manual entries. Peak's Semi Auto also offers automated exits, using their custom Auto PT logic.
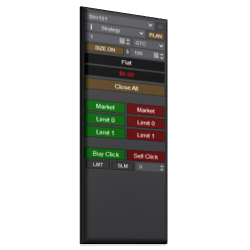
The Essential Chart Trader Tools is a starter pack for the Enhanced Chart Trader. It is full of features to help traders focus on decision making, remove stress and minimize mistakes. The Essential Chart Trader Tools can be added to any chart window in NinjaTrader.
A semi-automated strategy that uses the previous days Fibonnaci range and an EMA to enter and exit trades.
December 2, 2024
Mastering Sideways Markets With Auction Bars and Range Projections
November 19, 2024
Enhancing Your Automated Trading System: Key Insights from Best Pro Trade
November 14, 2024
NinjaTrader New Ecosystem Tools: October 2024 Edition
Enter Email for Updates