New "Ultimate A.I." indicator has it all: buy and sell signals, trend reversal signals, scalping signals, pullback alerts and stop loss placement lines. It’s multiple systems all in one. Learn more! Watch a demo tutorial by clicking the link! We also have a private chat group. Get a 5 day trial!
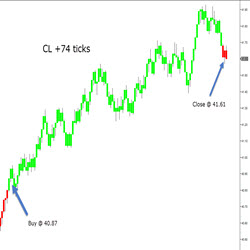
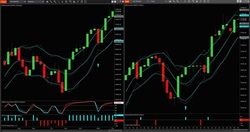
TrendFinder identifies what direction the market is moving. TrendFinder is universal and works with any market and any time interval. When an upward bias is detected, the bars are displayed in Green. When a downward bias is detected, the bars are displayed in Red.
Unleash the power of automated trading with the Obsidian Indicator Suite for NinjaTrader 8. A collection of innovative indicators, including the Automated Dark Diamond Trend Sniper, specially designed for precision and adaptability in different market conditions. Start your 7-day free trial now!
This is an automated trading strategy that is designed to trade ES futures.
Weekly long form insights on the markets with weekly and twice daily algorithmic levels coupled with intraday NQ, ES and CL trading journal.
IAStealth signals the entry when the shorter time frame momentum has reversed back in the direction of the trend. More important is to know when the longer time frame momentum is showing signs of reversing. IAStealth alerts the shorter time frame after IAMomentum/IATrend alert the longer time frame.
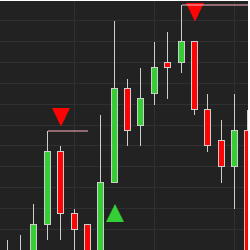
Entry Signals from TREMPER.com generates entries based on proprietary internal conditions. It allows you to manage your position based on chart size and your parameters.
Learn to flow with the market using a personalized and simplified strategy. This course includes a complete written and video curriculum with detailed homework reviews. One-on-one coaching and student-only groups to build confidence, consistency, clarity, connection and community.
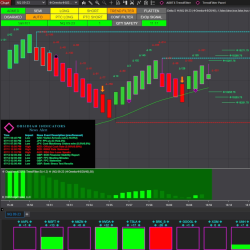
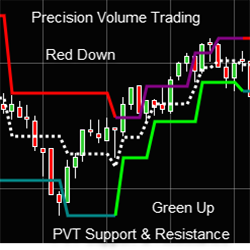
Precision Volume Trading Support & Resistance measures each swing point for traders to know where buyers and sellers are.
Gain a real trading edge. Complete personalized mentorship that teaches you what you need to know to become consistent in the markets. This is designed for struggling traders that actually want to make it. Book a FREE strategy call using the link provided to see if this is right for you.
December 2, 2024
Mastering Sideways Markets With Auction Bars and Range Projections
November 19, 2024
Enhancing Your Automated Trading System: Key Insights from Best Pro Trade
November 14, 2024
NinjaTrader New Ecosystem Tools: October 2024 Edition
Enter Email for Updates