Automatically snap trade execution screenshots or take a snap at a set bar interval. SnapMyTrade assists traders with journaling and post trade analysis.
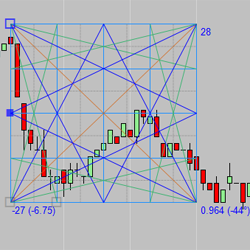
The IT_GannBox tool is fully loaded for chart analysis price prediction. This tool has all types of visual features and three modes of operation. Industry standard Fixed Ratio and FreeForm modes plus the custom FreeForm Ratio mode. Adding the IT_ChartSquare tool will allow visually accurate angles.
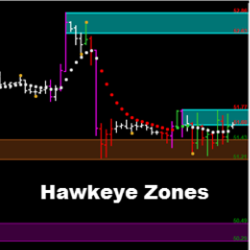
Hawkeye Zones add extremely accurate, predictive supply and demand zones (support and resistance) on your charts. Visualize market turning points and break out areas in all markets and timeframes. Buy now using code: “NT10Off” for a 10% discount.
The VTP was created to provide Veterans with an introduction to financial markets. The Stage 5 Online Course educates traders on how to approach their funding challenges within the Prop Firm space. It aims to helping support traders to succeed, and build a sustainable trading business.
TradingCoders offers conversion services between NinjaTrader 7, NinjaTrader 8, MetaTrader4, MultiCharts.NET and eSignal (among others). Have your NinjaTrader indicators or strategies converted from NinjaTrader 7 to version 8, or move your formulas to NinjaTrader from another platform!
The program combines TradingTotal traditional technical analysis methodology with the latest technology automated systems & tools. It is carried out through intense online/onsite live seminars & webinars, 'EduHome' video recorded seminars, supportive coaching and a unique individual mentor program.
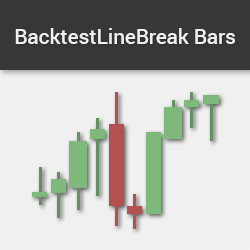
The Line Break Bar is one of the most effective ways to reduce chart noise. It provides accurate back-testing results by showing the correct open prices and restoring the wicks. Easily recognize divergence & price action patterns & eliminate noise from traditional minute charts. Get started today!
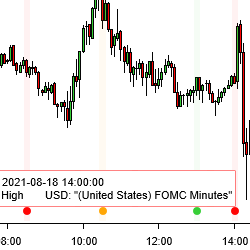
Improve planning of your trades by seeing when economic calendar news gets released – right on your NinjaTrader 8 charts. Option to select either Forex Factory or Myfxbook as news source. You can see news for the current week and historical news releases. You can also filter by news impact and more!
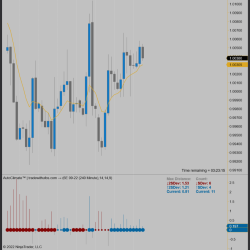
Intelligent technology assesses the market environment from a statistical point of view in order to answer the key questions before a trade: “Which side of the market should I be in?”, “Should I be a buyer or a seller?”, or “Should I simply avoid trading and not trade at all?”
100% FREE - The TAS Market Map Indicator delivers the most visually appealing customizable market profile tool for traders. Its color-coded sideways histograms clearly reveal volume at price, value areas (red zones), master point of control lines (aqua lines), gaps and congestion.
December 2, 2024
Mastering Sideways Markets With Auction Bars and Range Projections
November 19, 2024
Enhancing Your Automated Trading System: Key Insights from Best Pro Trade
November 14, 2024
NinjaTrader New Ecosystem Tools: October 2024 Edition
Enter Email for Updates