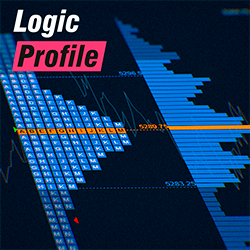
Includes volume profile and TPO market profile, presets for one-click charting, daily, weekly, monthly, date, composite, and drawn profiles. Offers defined or continuous session types and load optimization. All of these features make it one of the most advanced profiles available on the market.
TradingCoders offers custom indicator and automated trading strategy programming services. TradingCoders possesses intimate knowledge of trading and NinjaTrader, and builds projects ranging from simple alerts and visuals, to sophisticated multi-timeframe techniques of price and cycle analysis.
The Opening Range is the range obtained from the highest and lowest price of a security during the first minutes of daily trading activity. For example, an opening range can be calculated for the first 5, 15 or 30 minutes. This Opening Range is a multi-timeframe (MTF) indicator .
The STMA indicator offers traders the ability to auto plot higher timeframe Simple or Exponential Moving Average’s on smaller time framed charts. Learn More about the STMA!
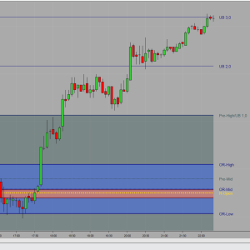
The Key Levels Confluence Indicator calculates various daily levels and combines them into powerful zones where price action is likely to respond in the future. Daily levels include the Open, High, Low and Close (OHLC) of past days, Fibonacci Levels, Whole Numbers, Current Day Levels and Pivots.
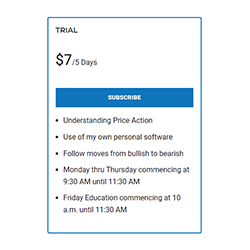
Education and trading is geared towards market structure and how to properly time pullbacks. The goal is to help every trader understand price action and follow moves from bullish to bearish and to enable the retail trader to trade confidently alongside institutional traders.
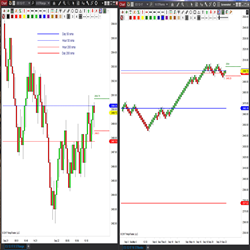
The Ultimate Pivot Points™ (UPP) Indicator Package is the most advanced and extensive collection of “Pivot Points” Indicators available. It includes every “Pivot Point” method along with several innovative features — making it one of the most complete Support/Resistance indicators on the market!
Do you want to overcome the challenges that often leave traders feeling overwhelmed and uncertain? Introduction to the Trader Brain will give you the practical knowledge to solve your money-losing patterns.
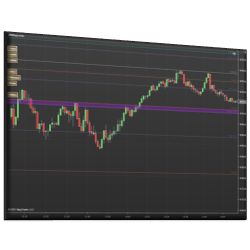
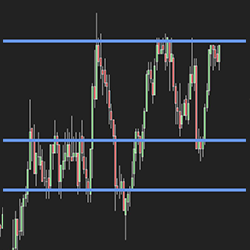
Support/Resistance Levels can be tedious to look for. You have to go back on your chart (with a changing Y axis), and it can be hard to spot every significant point of contact. Tyche Trading’s Automatic S/R Indicator eliminates that with a high level of precision. Get a seven-day free trial today!
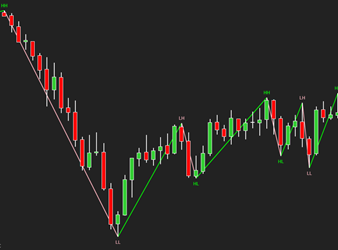
The ZigZag indicator is primarily used to identify significant highs and lows in the price chart, which helps traders filter out market noise and focus on important price movements.
December 2, 2024
Mastering Sideways Markets With Auction Bars and Range Projections
November 19, 2024
Enhancing Your Automated Trading System: Key Insights from Best Pro Trade
November 14, 2024
NinjaTrader New Ecosystem Tools: October 2024 Edition
Enter Email for Updates