The B.I.T.S (Breakout Intelligent Trading Signals) Indicator is designed around exclusive machine learning breakout technology for both swing trading and day trading stocks and futures on multiple timeframes.
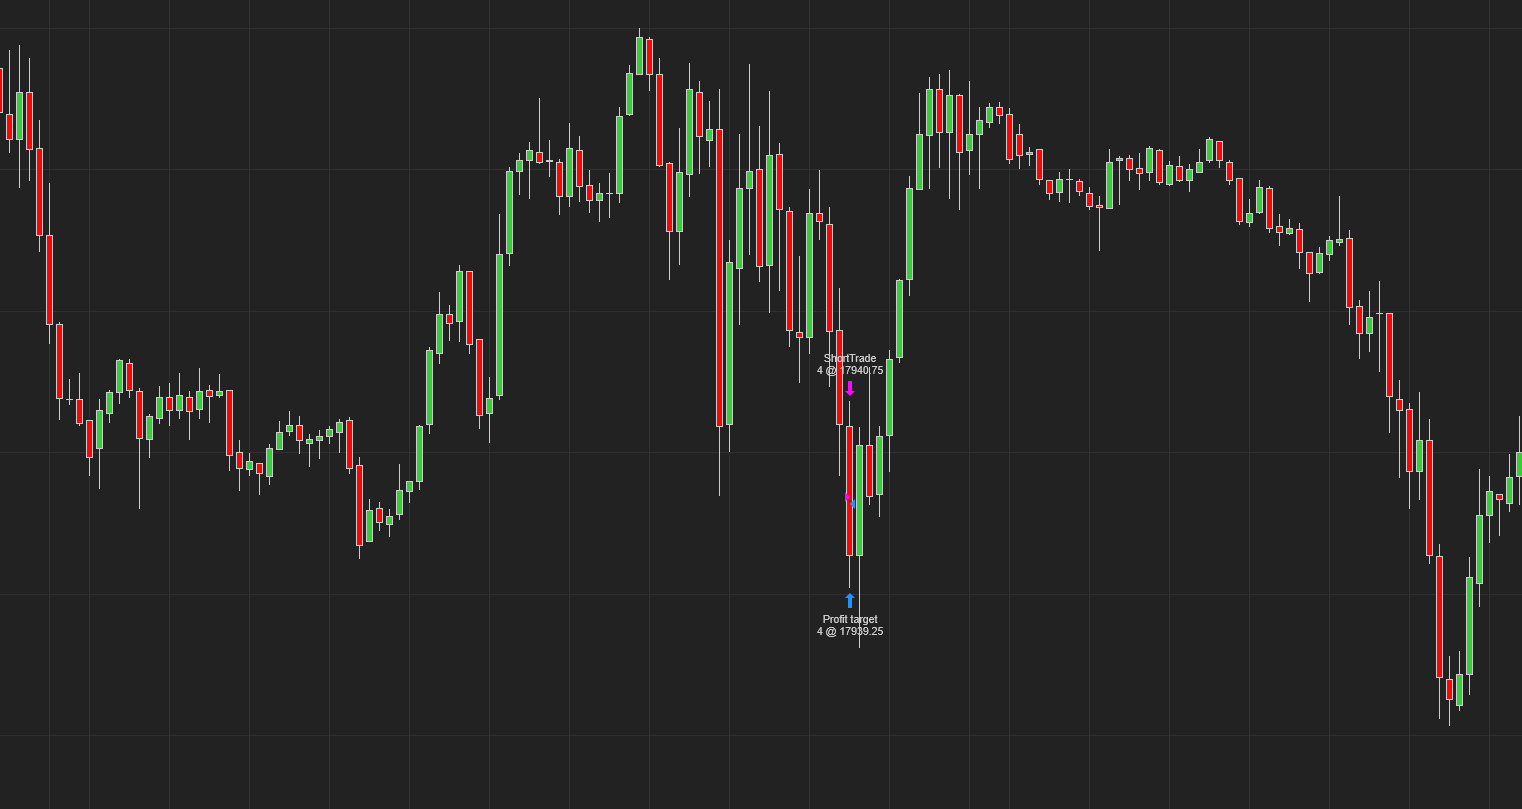
This algo-based buy sell NQ strategy customized number of traders per day.
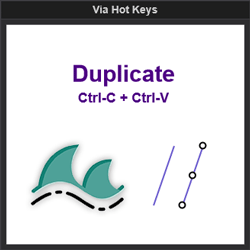
This indicator allows the user to copy-paste in one button, increasing application functionality and user charting efficiency.
Don't miss any more targets by a few ticks with Target Zone!
The Builder Blocks NinjaTrader courses will provide a good foundation in NinjaScript programming. Learn to create your own indicators and automated strategies. Recorded lessons permit you to work at your own pace. Let us help you start your NinjaScript programming.
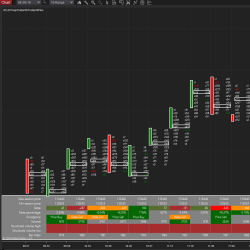
itcFootprint is an indicator for Order Flow and footprint. It displays data from the tape as footprint bars and also provides a statistic panel with powerful tools like delta analysis, divergence, volume structure, and unfinished business (bar by bar).
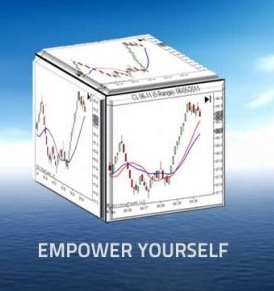
Do you want to know the trading setups we use? Create your own profile FREE on our website and you’ll have access to our course videos where we explain each of our patterns. Gain the knowledge to access our EPyF Trading Room and learn our way of understanding the market.
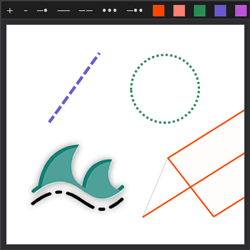
This indicator allows the user to change the color, stroke style and stroke size of drawn objects on the fly without having to dig through various menus. This increases application functionality and user charting efficiency.
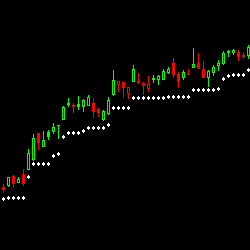
Based on ATR our Trailing Stop indicator has been designed to take all the hassle out of calculating and re-calculating your ‘stop losses.' It does this for you automatically. It also alerts if your stop is hit. A must for day and swing traders.
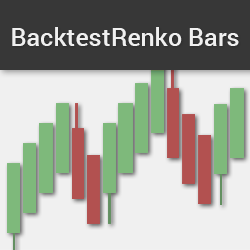
The hybrid Renko bar is two bar types in one. With adjustable backtesting capability, it utilizes true trade data for the Open, High, Low, & Close of each bar. Price gaps are accurately portrayed on the chart. Eliminate chart noise with one of the most precise Renko on the market. Get it now!
December 2, 2024
Mastering Sideways Markets With Auction Bars and Range Projections
November 19, 2024
Enhancing Your Automated Trading System: Key Insights from Best Pro Trade
November 14, 2024
NinjaTrader New Ecosystem Tools: October 2024 Edition
Enter Email for Updates