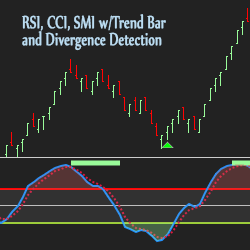
Use UppDnn.com’s Momentum Indicators to identify divergence and momentum changes as signals emerge at reversal areas. These upgraded indicators include Relative Strength Index (RSI) with Divergence Detection, Commodity Channel Index (CCI) and Stochastic Momentum Index (SMI) with a Trend Bar.
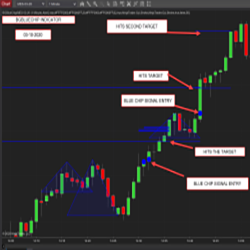
The BG BLUE CHIP clearly & accurately tells you when to enter a trade with a blue dot, and when to exit a trade with a blue horizontal line. It is that simple. The BG BLUE CHIP is one of the most popular indicators and is trusted by thousands of traders worldwide.
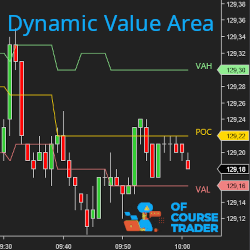
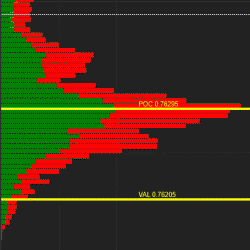
The Dynamic Value Area allows you to visualize in real time the evolution of the POC, VAL, VAH levels corresponding to the most traded value area. It also gives you historical levels. Its NinjaScript API will allow you to integrate the value area into your own indicators and strategies.
Empower your trades with precision. Set your daily support and resistance levels, and this bot executes and manages your trades, seamlessly. Trading made simple. Start your free trial today.
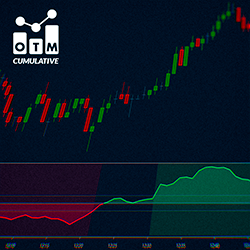
OTM Delta Cumulative is a histogram displaying delta behavior, measuring buying or selling strength. It helps identify trend transitions and clear trends. The curve direction shows the pressure difference between buyers and sellers, aiding informed market decisions.
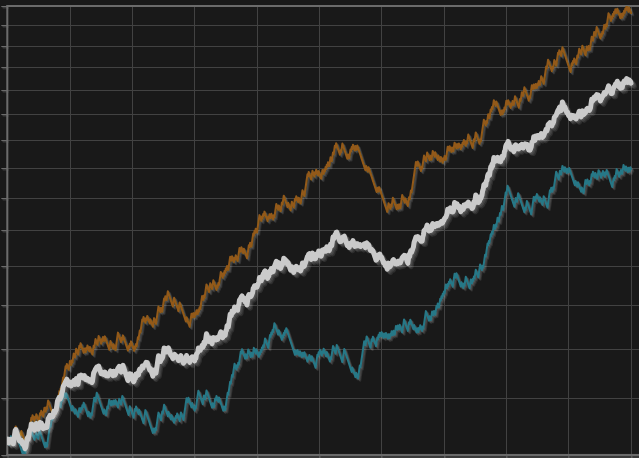
This is a trend following trading system trading simultaneously on three configurable and back testable time frames. It is aimed to be used as a CTA, trend following, multi assets trading system where the tradable assets universe is composed by futures on indices, commodities and foreign exchanges.
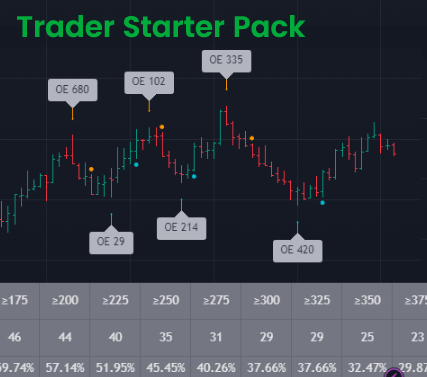
Welcome to the Trader Starter Pack: This free 5-day video course that’s taken over 38 years of combined trading experience, along with everything they’ve learnt from coaching over 20,000 clients, and packed it all into this easy to follow 5-day video course.
All-in-one solution for futures traders, including powerful order flow reversal signals, daily trading plans, live morning voice chat/trading, in-depth courses on our strategy and the mental aspects of trading. It's everything you need in one place to develop your skills.
itcMarketProfile is a highly customizable indicator for monthly, weekly and daily market profile. It draws the profile and important levels like POC, VAH and VAL. The value area volume percentage is adjustable, and the indicator can display historical values of POC, VAH, VAL as an option.
The Value Chart Indicator draws bars over a dynamically created scale from the last highest to the lowest values over a period. It attempts to spot market oversold and overbought areas on a short time scale, when price is most probable to revert to its mean.
December 2, 2024
Mastering Sideways Markets With Auction Bars and Range Projections
November 19, 2024
Enhancing Your Automated Trading System: Key Insights from Best Pro Trade
November 14, 2024
NinjaTrader New Ecosystem Tools: October 2024 Edition
Enter Email for Updates