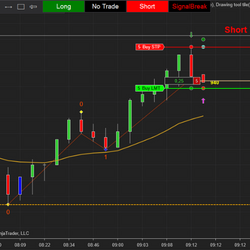
Trade two-legged pullback with this Second Entry Indicator! This is a semi-automated, two-legged pullback strategy using the built-in trading-buttons. Get alerts and your orders are placed automatically at the correct spot (no more dragging orders).
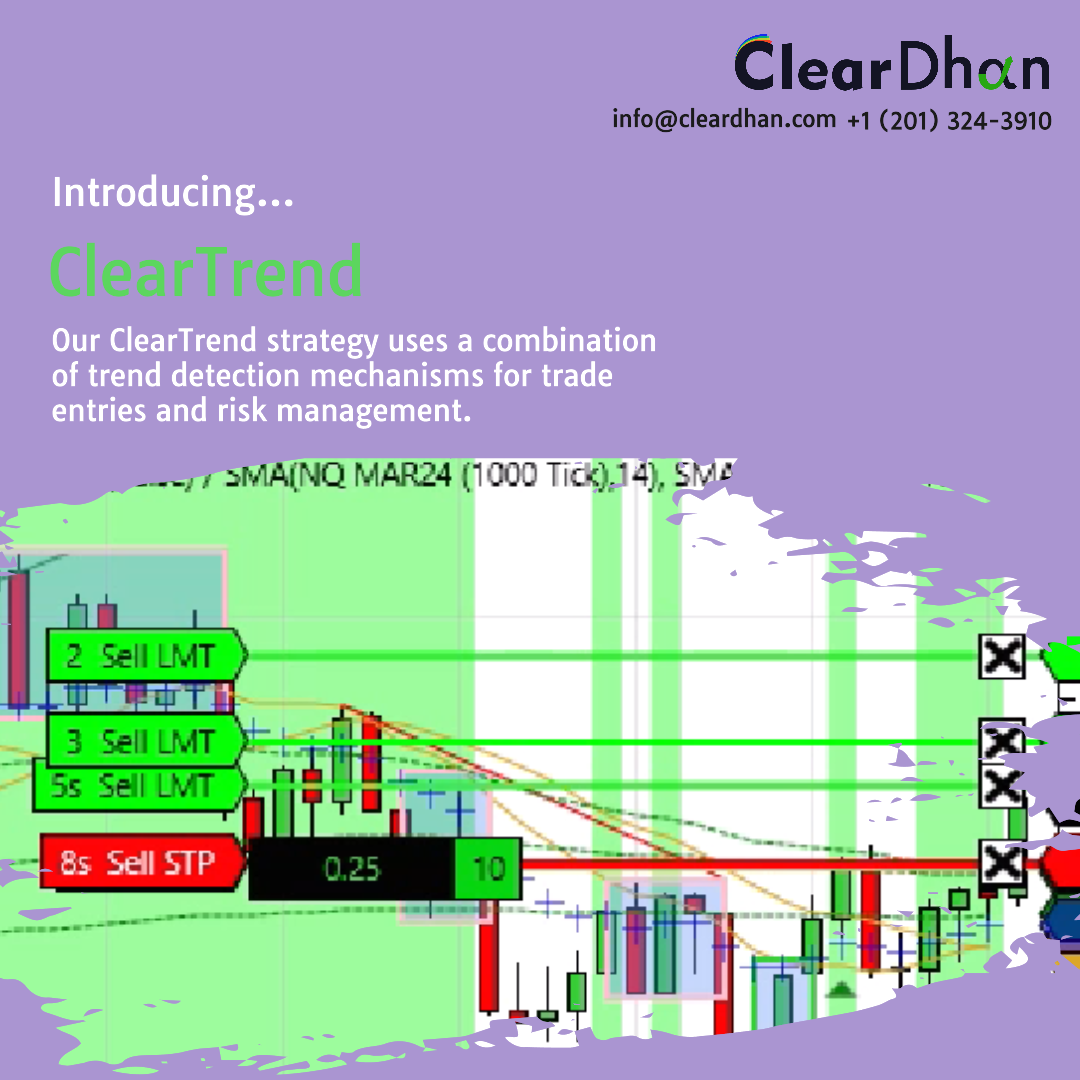
ClearTrend uses a combination of trend detection mechanisms for trade entries and risk management. Works to identify optimal trades using real-time time responsiveness to opportunities using trend strength. Available as a fully automated strategy or as an indicator form. Five-day free trial.
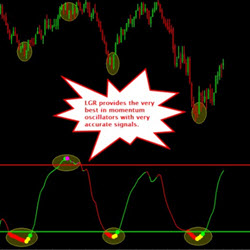
The LGR is a composite Triple Momentum Index Oscillator. LGR indicator is a proprietary design that gives the trader the crème de la crème of momentum oscillators by combining into a single indicator. No more figuring out which oscillator to choose.
Master quantitative trading with our courses. From back-testing basics to advanced strategy development, learn to build systematic trading systems. Explore futures, pairs trading, & essential Python programming tailored for financial markets. Gain a trading edge with real-world examples. Enroll now!
EPyFBarsType is a tick-based bar, unlike time-based bars such as regular Japanese candles. These bars are one of the main components of our system, due to the objectivity they provide for technical analysis. This bar type helps in identifying market moves and avoiding choppy areas.
This is an introductory class that is perfect for beginners. It covers a multitude of topics including Technical Analysis and trading with custom indicators. Learn through one-on-one and group live zoom classes daily.
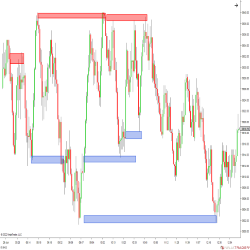
The V-Zones Trading Course is a fresh and unique approach to trading supply and demand and value. The dynamic approach to analysis gives you a trading map with precise trade locations and the skills to spot potential turning point locations in the markets.
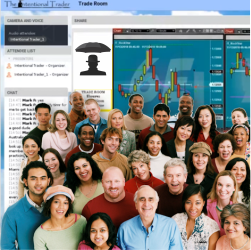
Day trading six futures instruments every day from 9am until 12pm Eastern time. Watch the Intentional Trader system in action in real time. Listen to a trade room moderator call out trades before entering them. They have been trading the same system and indicators since 2009!
Free daily newsletter - global news & views; free weekly YouTube (Sunday) to prepare you for the week ahead; 1-day workshops; 1-week courses zero to hero; accredited masterclass financial & commodity trading; flexi-masterclass, which includes a free trading challenge; and trader mentoring.
Flagship Program teaching the convergence of Elliott Waves, Fibonacci and Harmonics with a simple strategy which offers trade setups for each part of the market cycle. Learn six trade setups with trade plans. Good for day, swing and position traders.
December 2, 2024
Mastering Sideways Markets With Auction Bars and Range Projections
November 19, 2024
Enhancing Your Automated Trading System: Key Insights from Best Pro Trade
November 14, 2024
NinjaTrader New Ecosystem Tools: October 2024 Edition
Enter Email for Updates