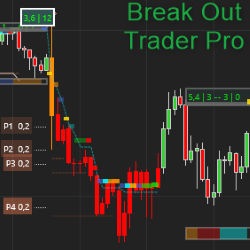
Accumulation or Distribution, Consolidations and Break-Outs. This indicator finds consolidation phases and signals great trade set-ups when the market breaks out from these ranges. It determines profit targets and stop loss levels. It also calculates the "heat" and has many other great features.
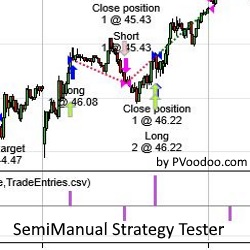
Do you have an idea which you would like to test without actually writing the strategy code to get the trading results? A simple way to do that is by using the PVAddManualTrades and PVUseManualTrades strategies, both utilizing statistics and options from the Strategy Analyzer. Try them free!
The KwikPop Consistency Program is a 6-month intensive small group study designed to teach traders how to achieve consistent results. The program includes daily tutorial sessions followed by instructor led live market trading. Space is limited, reserve your spot today!
Trade with the best conditions in order to become an extraordinary trader, follow the risk management rules and reach your target in as little as 10 days. Once you have completed the target, we will connect you with one of our funding partners.
Volatility Quality Indicator (VQI) is a technical indicator that was developed to identify quality stocks with low volatility. The indicator is based on the assumption that assets with low volatility are less risky & more stable. The original concept by Thomas Stridsman was first published in 2002.
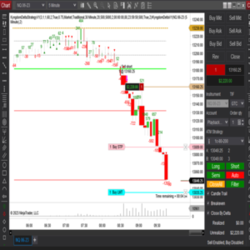
Delta Volume Supply and Demand Indicator that comes with a Semi Auto Chart Trader. Prop firm compliant for evaluations and live accounts. Reads what is happening right now in the market with no lag. Templates, workspaces and manual included. Works in all markets. Free 7-day Trial.
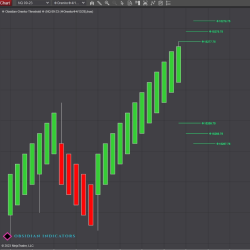
Orenko bars focus on price movements, filtering out market noise and providing a clear representation of trends and reversals, making it easier for traders to identify trading opportunities. Orenko Threshold highlights the potential formation of the next three bars trend and reversal threshold.
This ES S&P Day trading course uses Fibonacci technical analysis to identify entry and exit strategies. Rose has backtested for many years to determine the optimal Fibonacci Retracement and Extension levels for a consistent system. Get started with a free consultation with Rose!
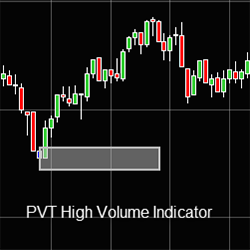
Precision Volume Trading High Volume Indicator lets you know where the volume is being traded to trade with high liquidity.
Price Action Harvester™ scans all markets to find consistent price action patterns based on historical data. Know how price moved for any instrument on particular days, during particular time-frames. A powerful tool for day traders. Don't miss this indicator!
December 2, 2024
Mastering Sideways Markets With Auction Bars and Range Projections
November 19, 2024
Enhancing Your Automated Trading System: Key Insights from Best Pro Trade
November 14, 2024
NinjaTrader New Ecosystem Tools: October 2024 Edition
Enter Email for Updates