The AVALON Strategy is a relaxed long-term End-of-Day (EOD) trading strategy for the Futures Market. It requires minimal effort and is ideal for traders who like to take it easy and keep things as stress free as possible. Test the AVALON Performance now with the Online Backtester!
The LogikDynamicRange is a unique Range Bar with Dynamic Resizing capabilities. This is done by employing a non-lag range determination technique, continuously adapting the bar size throughout the day, capturing trends while displaying consolidation areas very easily.
Entry Signals from TREMPER.com generates entries based on proprietary internal conditions. It allows you to manage your position based on chart size and your parameters.
As a NinjaScript Consultant since 2008, Moore Tech, LLC has the experience to provide the solutions traders need. Whether traders are looking to have code converted from another platform, or bring their trading ideas to life, Moore Tech, LLC can help. Contact them today for a free project estimate!
Gorilla Futures offers a complete FootPrint indicator. This indicator works on all NinjaTrader 8 licenses. FootPrint Pro™ is 100% customizable and can identify and alert traders to imbalances, delta signals, volume, and more.
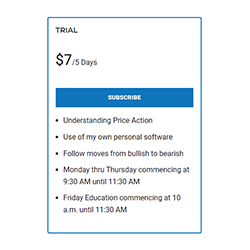
Education and trading is geared towards market structure and how to properly time pullbacks. The goal is to help every trader understand price action and follow moves from bullish to bearish and to enable the retail trader to trade confidently alongside institutional traders.
If you can see when price and momentum have diverged, then you can evaluate when and where price may change directions. The SuperD indicator tracks seven different momentum oscillators. You don't even need to have any of the momentum indicators on your chart!
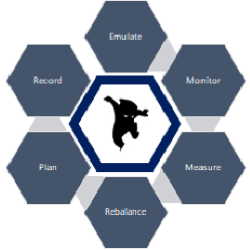
The Tradelytics platform enables investors, wealth managers and analysts to emulate and execute portfolio management with the live market data for both simulated and live portfolios. The portfolio is measured for risk and reward. Users anywhere can record fundamental and technical analyses.
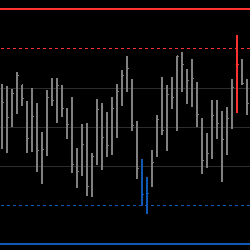
The Value Chart Indicator draws bars over a dynamically created scale from the last highest to the lowest values over a period. It attempts to spot market oversold and overbought areas on a short time scale, when price is most probable to revert to its mean.
Get information about the development of a dynamic and descretionary trading model. This is intended to inform people of a coaching program tailored to their specific needs in order to make them more consistent traders.
December 2, 2024
Mastering Sideways Markets With Auction Bars and Range Projections
November 19, 2024
Enhancing Your Automated Trading System: Key Insights from Best Pro Trade
November 14, 2024
NinjaTrader New Ecosystem Tools: October 2024 Edition
Enter Email for Updates