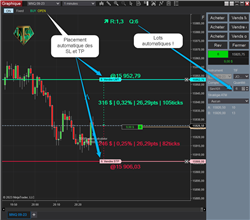
This indicator will automatically calculate for you the quantity of lots according to the position of StopLoss and the risk as a percentage of your capital. It will also place your StopLoss and TakeProfit. Finally get constant risk by trading on Futures contracts!
If you can see when price and momentum have diverged, then you can evaluate when and where price may change directions. The SuperD indicator tracks seven different momentum oscillators. You don't even need to have any of the momentum indicators on your chart!
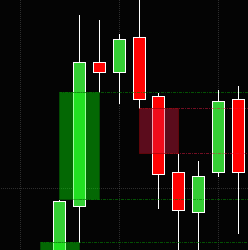
ICT's Fair Value Gap indicator retains a configurable number of gaps, and there's a setting to remove those that have been crossed by price. The style of the rectangle and the rays from the gaps are customizable by creating a template for a rectangle named "FVG Up Gap" (for the Up gaps).
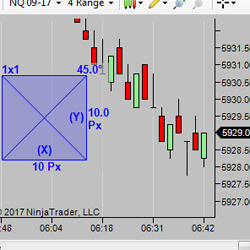
This tool is a valuable visual aid for traders who use Gann, Fibonacci, Point and Figure charts and want to see true angles. Simply load it on the chart and push the toolbar button when you want to use it, then adjust an axis until the chart is square. Using the 'Keep Centered' option will then keep price in the chart area while the chart is squared.
VWAP MNTrader strategy is a fully automated trading system. Trading is based on the VWAP indicator for the daily, weekly and monthly periods on the breakdown test strategy with a filtering system. It has an improved position support system with flexible settings to improve trading consistency.
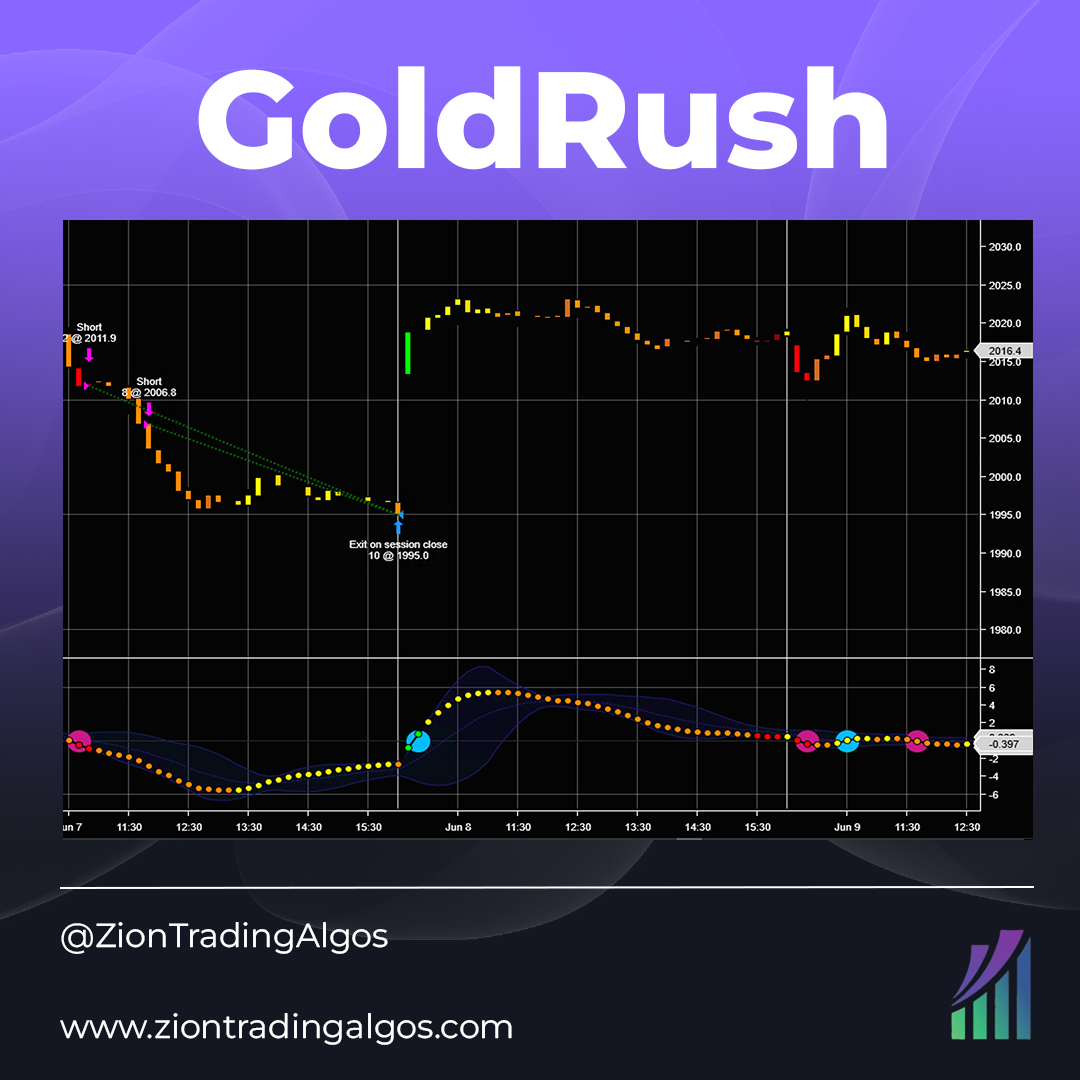
GoldRush is an intraday strategy on the 10-minute chart. Designed to take an initial amount of GC contracts, it uses a few custom indicators that will also be included with purchase.
Advanced Wyckoff Course: Learn advanced concepts of the Wyckoff Method in a simple way. This will teach you unique concepts that will make you an expert in the Wyckoff methodology and take your analysis and trading to the next level.
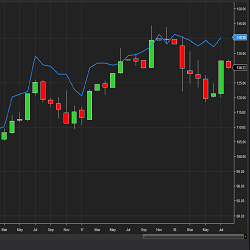
The StockCalcValuation indicator displays a fundamental valuation for the company you are examining. At StockCalc we value 8000 companies each night using 6 valuation models or data points and determine a Weighted Average Valuation from these calculations for display. Get your free trial now!
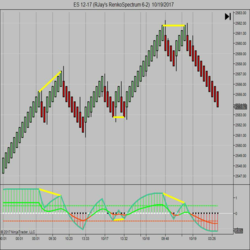
The Divergence Indicator offers combinations of single, double, and hidden divergence displays. Divergence measured is price action compared against a selectable NinjaTrader indicator. The selection list includes TRIX, RSI, CCI, RVI, MACD, TSI & more. Get a free trial now!
Hey Overachiever, I see you! Don’t worry—you’re in the right place. You’ve made a habit of outperforming, so why not arm yourself with the best team to help continue your winning streak? We code (like hackers) and launch (like marketers) your products. Click and schedule a free consultancy call.
December 2, 2024
Mastering Sideways Markets With Auction Bars and Range Projections
November 19, 2024
Enhancing Your Automated Trading System: Key Insights from Best Pro Trade
November 14, 2024
NinjaTrader New Ecosystem Tools: October 2024 Edition
Enter Email for Updates