Get information about the development of a dynamic and descretionary trading model. This is intended to inform people of a coaching program tailored to their specific needs in order to make them more consistent traders.
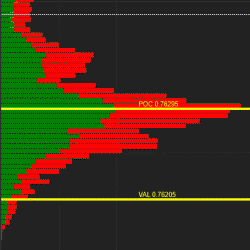
itcMarketProfile is a highly customizable indicator for monthly, weekly and daily market profile. It draws the profile and important levels like POC, VAH and VAL. The value area volume percentage is adjustable, and the indicator can display historical values of POC, VAH, VAL as an option.
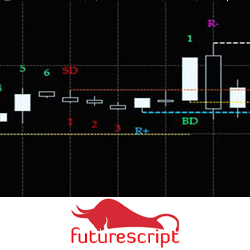
The Cycle Trend was developed as a way to evaluate trends with as little lag as possible compared to more conventional indicators such as the ADX or MACD. The idea behind this is that the price action and the shapes of the bars relative to each other is more accurate at defining the mood.
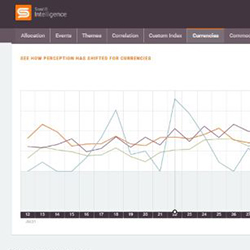
Sentifi's crypto sentiment analytics detect sentiment shifts in real time from over 500 million tweets and 2 million news and blog articles published worldwide every day. Sentifi mines this vast pool of data for investment insights to inform how market momentum is shifting ahead of price movements.
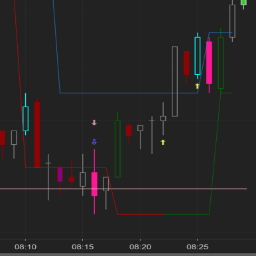
The system looks for the highest high and lowest low over past bars, then the system tags the entry with a line that is proportional to your entry settings. Then the strategy calculates: Imbalance, velocity, momentum and probability.
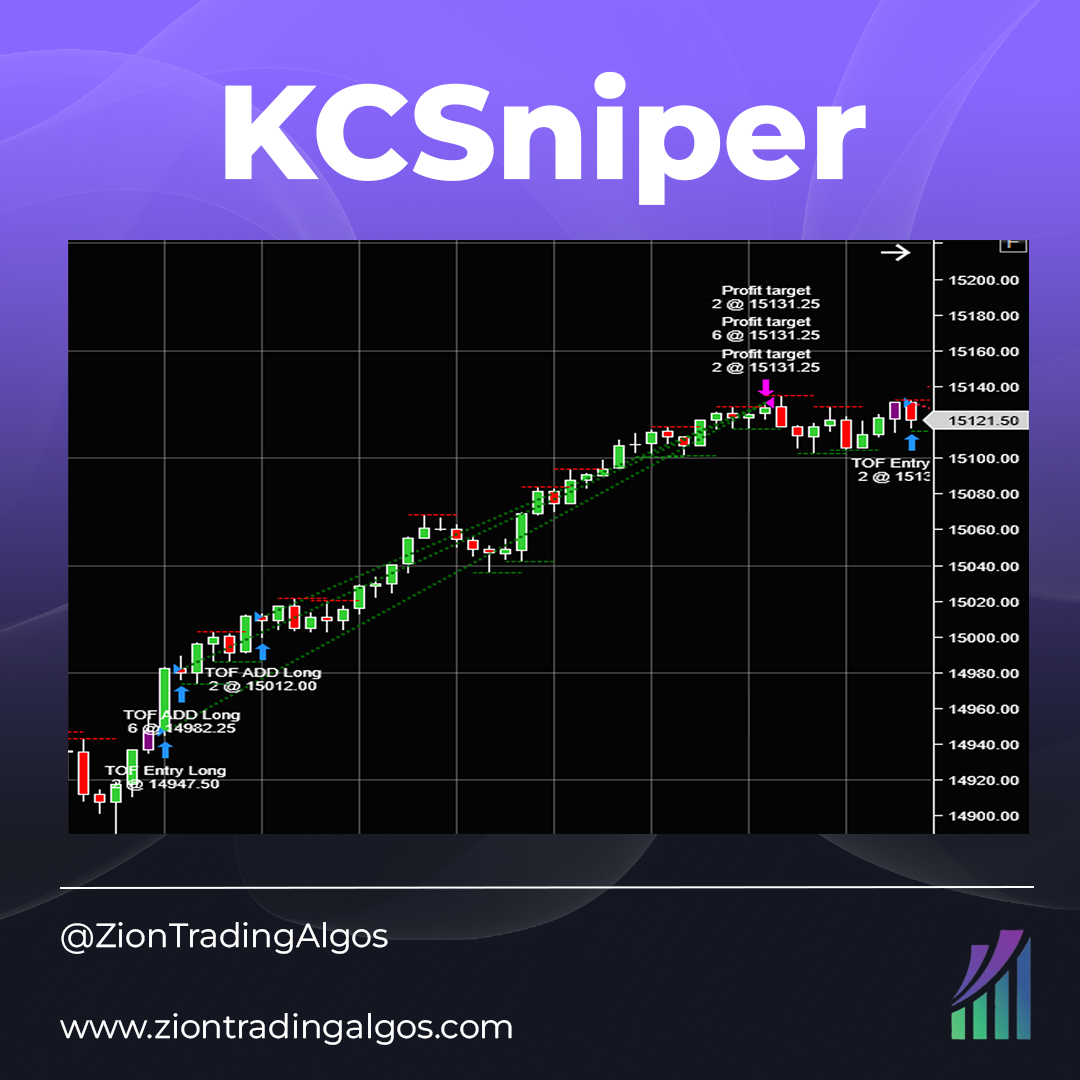
KCSniper is a Keltner Channel-based system on the 10-minute chart. It is long only and does not pyramid into positions, but has a single entry and exit model. It uses volatility based stop loss and take profit targets to remain adaptable. Trades MES and MNQ.
David Misselhorn is a software developer with over 30 years of development experience in trading clients, market data and order-execution software. He writes indicators and strategies for individuals wishing to automate their trading and analysis activities.
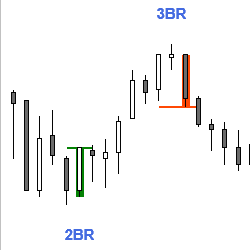
This indicator identifies 10 different signal bars or patterns for possible reversals by examining bar features and relation to prior bars. It can be used as a discretionary indicator or for automated (e.g. BloodHound) trading. Get started with a free 20-day trial today!
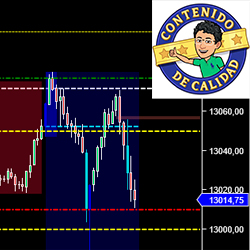
Análisis de mercados americanos una hora antes de la apertura: Futuros de Nasdaq (NQ y MNQ), S&P (ES y MES), Dow Jones (YM y MYM), Russell (RTY y M2K), Petróleo (CL y MCL) y Oro (GC y MGC). Determinación de niveles de compra y venta con Price Action y Smart Money.
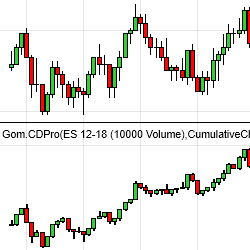
GomCD for NinjaTrader 8 displays the Delta information of the chosen instrument. It shows cumulative or non-cumulative charts, for easy delta analysis and delta divergence identification. It can also be used in custom NinjaTrader strategies and the Market Analyzer.
December 2, 2024
Mastering Sideways Markets With Auction Bars and Range Projections
November 19, 2024
Enhancing Your Automated Trading System: Key Insights from Best Pro Trade
November 14, 2024
NinjaTrader New Ecosystem Tools: October 2024 Edition
Enter Email for Updates