Elevated trading with precision and autonomy. Trade smarter, hands-free! Does not activate everyday as it is looking for specific market opportunities.
Everything you need to know about consistent trading video tutorial course. This course covers the following: How to use the Metatrader4 trading app, market Analysis (Fundamentals & Technicals), risk management, trading psychology (trading plan, journal, management, goal, etc.)
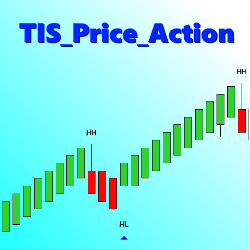
The TIS_Price_Action indicator detects and ranks pivots, then looks for a user specified sequence, such as Highest Low followed by Highest High to paint a long signal. Users can trigger 1 to 3 pivots to trigger a signal.
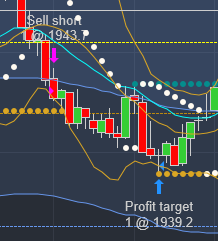
An indicator with automated entry notification along with entry, stop loss and profit target spot included.
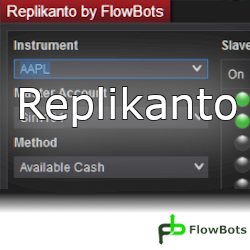
This is an order replication add-on between accounts. It replicates orders from a Leader Account to multiple follower accounts according to the replication method selected. There are several replication methods, each with its own functionality. It replicates orders in both NinjaTrader 7 & 8.
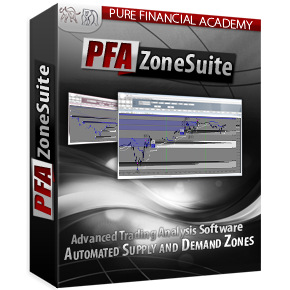
PFAZoneSuite is advanced supply and demand trading! Indicator package includes automated volume zones, volume profile, order flow analytics, trend lines, fibonacci retracements, market structure, trade data box and more! Compatible with NinjaTrader 8. Click here for a free demo!
Learn to code automated strategies, indicators and add-ons for NinjaTrader 8. Join our NinjaScript custom programming course. No prior programming knowledge is required. Learn from beginner to expert level in live sessions tailored for custom NinjaScript programming.
Ocean Theory considers all time frames simultaneously, and lets the market tell you which ones have the most significance, since that changes with time. Determine trend, pinpoint end of counter-trend moves for optimal entries, and apply natural moving averages. Sign up for a 30 day free trial!
Mondia Trading shares his experience in the futures markets and Forex with his YouTube channel subscribers. He gives trading lessons to his students at the university.
Download a 14-day test period of this trading indicator that identifies points to enter the market for price pullbacks and reversals. The indicator uses pure price action, which makes it possible to get rid of lagging indicators. Be independent of the values and stage of the market.
December 2, 2024
Mastering Sideways Markets With Auction Bars and Range Projections
November 19, 2024
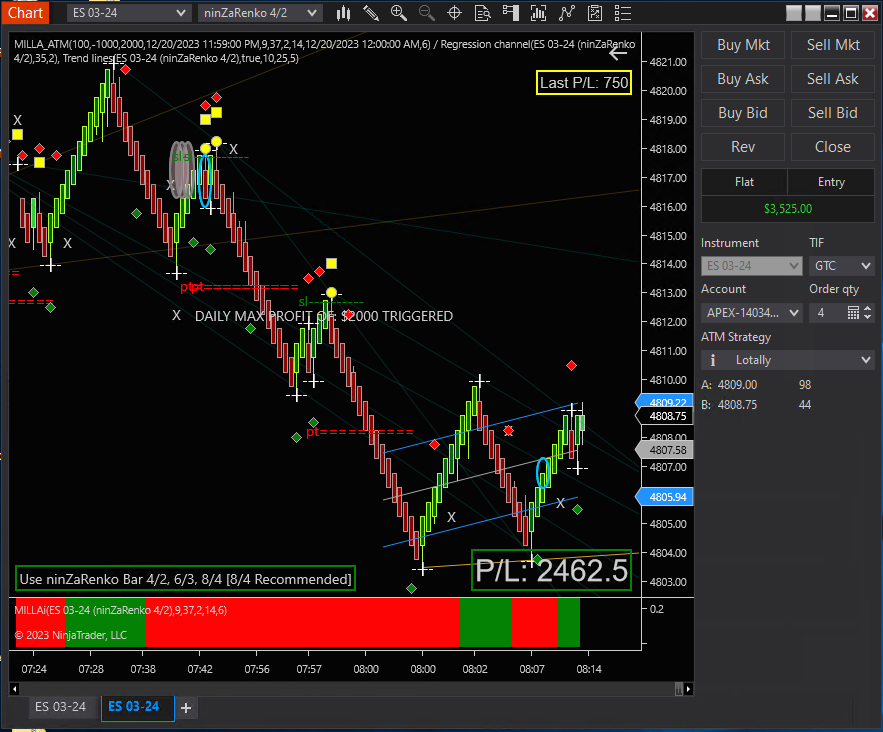
Enhancing Your Automated Trading System: Key Insights from Best Pro Trade
November 14, 2024
NinjaTrader New Ecosystem Tools: October 2024 Edition
Enter Email for Updates