We focus primary on the time side of the markets using Fibonacci, Support and Resistance, Commodity Supply and Demand, Chart Geometric Patterns, Cycles, Seasonals and CoT Report.
L’orderflow trading è lo studio dei volumi nel tempo e nello spazio sia nel book che nel volume profile. Individuare le zone di prezzo con maggior volume di scambio sul book e nel tempo. Studiare la dinamicità dei volumi sul book. Come usare il WVAP. Come usare il Cumulative Delta.
At ProlongWealth Trading, they offer a gateway to the Futures Prop Firm industry through tailored recommendations, exclusive discounts, and comprehensive YouTube education.
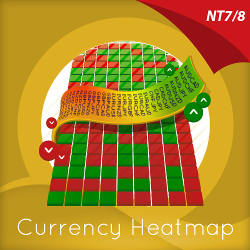
The Currency Heatmap displays the “hottest” and “coldest” areas of the forex landscape. Vertically, 28 currency pairs are listed and ranked from the most bullish to the most bearish. Horizontally, each cell then displays bullish and bearish sentiment across multiple timeframes instantly.
Curious about NinjaTrader 8's supplied indicators, or seeking detailed information about them? Follow this link for an in-depth exploration of each indicator, providing you with the knowledge you need for effective trading. Dive into comprehensive insights now!
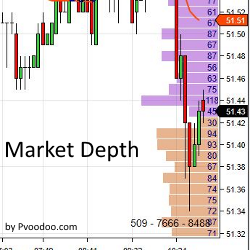
The addition of Market Depth indicators allow traders to see the bid/ask data based on price in real time. Similar to the Level II data featured in the NinjaTrader SuperDOM, the Market Depth Indicator plots bid/ask data directly on a chart. Learn more!
The Arnaud Legoux Moving Average (ALMA) is a powerful technical indicator designed to improve the accuracy of moving average calculations. ALMA indicator is an advanced variation of traditional moving averages that aims to reduce lag and noise while providing better responsiveness to market changes.
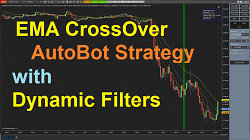
The EMA CrossOver Strategy is one of the simplest, for ease of use and understanding. This simple strategy has been enhanced with a third EMA as a filter for taking a long or a short entry. This EMA filter helps reduce unwanted entries.
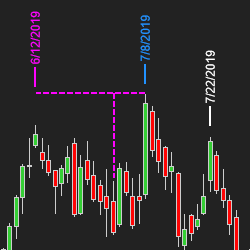
CB ZoneChart V5.0 update was just released. It now comes with turning bars included to help gage the tops and bottoms or turns in the market. Also includes the opening ranges, zigzag support and resistance, golden zone Fibs, and the most requested blue dotted lines support and resistance.
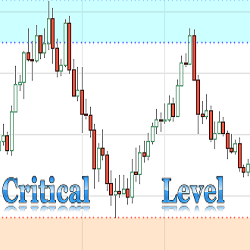
The purpose of this indicator is to automatically plot critical support and resistance levels on a chart. The Critical Support & Resistance Level Indicator comes with customizable alerts and can be added as a Market Analyzer column.
December 2, 2024
Mastering Sideways Markets With Auction Bars and Range Projections
November 19, 2024
Enhancing Your Automated Trading System: Key Insights from Best Pro Trade
November 14, 2024
NinjaTrader New Ecosystem Tools: October 2024 Edition
Enter Email for Updates