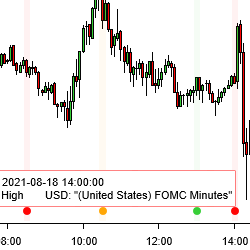
Improve planning of your trades by seeing when economic calendar news gets released – right on your NinjaTrader 8 charts. Option to select either Forex Factory or Myfxbook as news source. You can see news for the current week and historical news releases. You can also filter by news impact and more!
Join The BSG Live Trading Room Community. Trade live with a professional trader, trade by trade. The BSG Trade Room is a place where traders discuss and exchange ideas while learning and trading together. Join us everyday as you watch us trade live and view our proprietary software in action.
The MegaDownloader add-on allows you to download historical data asynchronously in a single window. Load instruments by type and view specifications and all available expiries for each instrument, including rollover period and date/time range for tick, minute, and day-based periods.
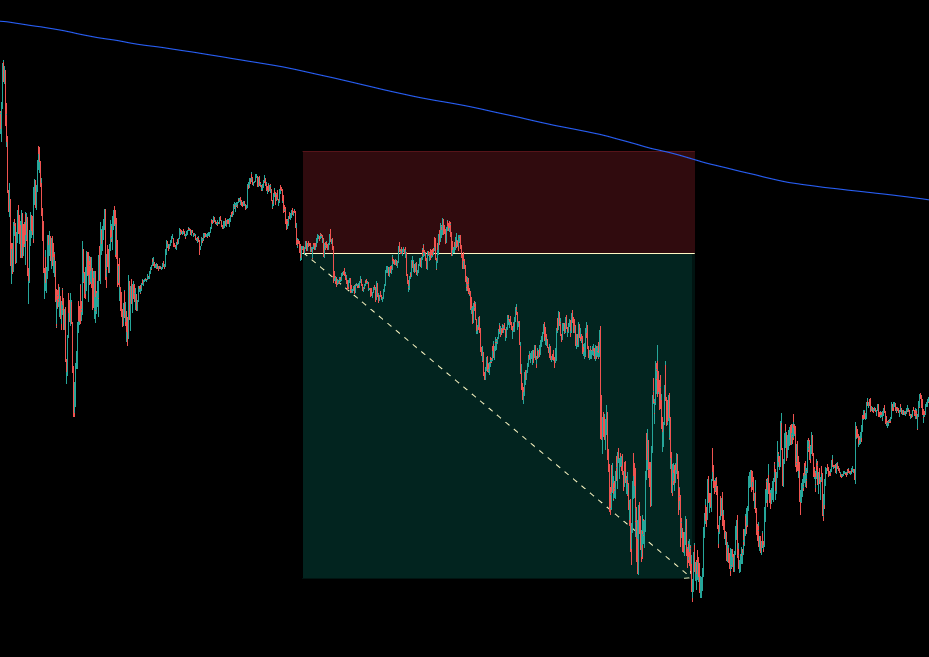
Introducing a groundbreaking "Future Signal Zone" concept, the system predicts Support/Resistance zones ahead of the present price. With compatibility across different chart types, ZoneGPT * From The Future assures adaptability, addressing both trend riding and pinpointing reversals.
The Zerolag HATEMA is based on a TEMA that uses Heikin-Ashi candles as input series. This indicator does not depend on the selected input series, as it uses open, high, low and close of each candle.
Innovative Trading Solutions has been building indicators, fully-automated or ATM Strategies, chart types, and chart styles to client specifications for over 8 years. They also offer NinjaTrader 7 to NinjaTrader 8 conversion services. Get a free quote for your project today!
With this strategy you can optimize any parameter from the trend detection and strength filter to the entry and exit method, breakout or mean reversion, exiting at target or trailing the stop until the trend goes.
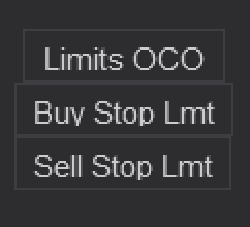
Bars Edge Trader Button and OCO Timer pack for NinjaTrader 8. An easy fast solution to apply Limit Orders to your Chart Trader. Included are three timers for adding OCO Limits entries throughout the day to catch a news cycles semi-automatically.
The Deep Signal Machine Learning uses machine learning to create optimized trade entries for automated trading. Traders can create machine learning models using their choice of indicator or instrument data. Visit DeepSignal.Tech for more information or get started with a two-week free trial today!
SpeedyAlert is a free tool that sends you an email notification if a running application crashed, stalled or is short on RAM & other critical resources. This is a very useful tool for PC’s hosting 24/7 automated strategies. Avoid these not so funny “surprises” & download SpeedyAlert today!
December 2, 2024
Mastering Sideways Markets With Auction Bars and Range Projections
November 19, 2024
Enhancing Your Automated Trading System: Key Insights from Best Pro Trade
November 14, 2024
NinjaTrader New Ecosystem Tools: October 2024 Edition
Enter Email for Updates