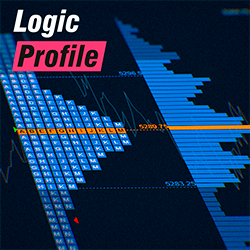
Includes volume profile and TPO market profile, presets for one-click charting, daily, weekly, monthly, date, composite, and drawn profiles. Offers defined or continuous session types and load optimization. All of these features make it one of the most advanced profiles available on the market.
Speeding Trading Servers offers high performance co-located virtual & dedicated servers (VPS) for professional & retail traders. Optimize fills, reduce slippage & run automated trading strategies 24/7 from any location. Sign up for a free one week trial today!
PriceIsKing.com's Futures RAM Indicator is based on a powerful moving average pattern recognition algorithm developed with years of research and testing. Get started with a free 2-week trial today!
Learn to code automated strategies, indicators and add-ons for NinjaTrader 8. Join our NinjaScript custom programming course. No prior programming knowledge is required. Learn from beginner to expert level in live sessions tailored for custom NinjaScript programming.
The Quantum Trend Monitor gives traders the confidence to follow trends, by incorporating an easy-to-read colored representation of current market trend. Use the Trend Monitor in tandem with other trend following analysis tools to help eliminate emotions from your trading!
Advanced Trading Signals offers support to traders wishing to transform their trading concepts into workable indicators and fully automated strategies. They use best practices and leverage decades of programming experience to build and deploy solutions for traders of all types.
Master Futures, Pairs & Swing Trading: Dive into essential futures trading mechanics, craft robust strategies, and explore quantitative analytics for pairs & swing trading strategies with our comprehensive course. Join to optimize your portfolio and trade with confidence! Signup now!
KaseX is a symbol based technical analysis trading study with a simple, uncluttered display. KaseX captures dozens of complex technical signals in multiple time-frames. Variable optimization is unnecessary as pre-configured sensitivity settings are built in. Take a free 30-day trial today!
GAP/VWAP Fail is one of Scott's favorite stock setups that can be also applied to futures. A frequent & highly favorable risk-reward play that finds an additional edge by understanding order flow, watch Scott explain it in detail & demonstrate with multiple examples including entry & exit rules.
This comprehensive program begins with the Basics of Trading, where you'll learn fundamental concepts, market structures, and essential terminologies. Progressing to the Intermediate Strategies module, you'll dive into technical analysis, risk management, and trading psychology.
December 2, 2024
Mastering Sideways Markets With Auction Bars and Range Projections
November 19, 2024
Enhancing Your Automated Trading System: Key Insights from Best Pro Trade
November 14, 2024
NinjaTrader New Ecosystem Tools: October 2024 Edition
Enter Email for Updates