L’orderflow trading è lo studio dei volumi nel tempo e nello spazio sia nel book che nel volume profile. Individuare le zone di prezzo con maggior volume di scambio sul book e nel tempo. Studiare la dinamicità dei volumi sul book. Come usare il WVAP. Come usare il Cumulative Delta.
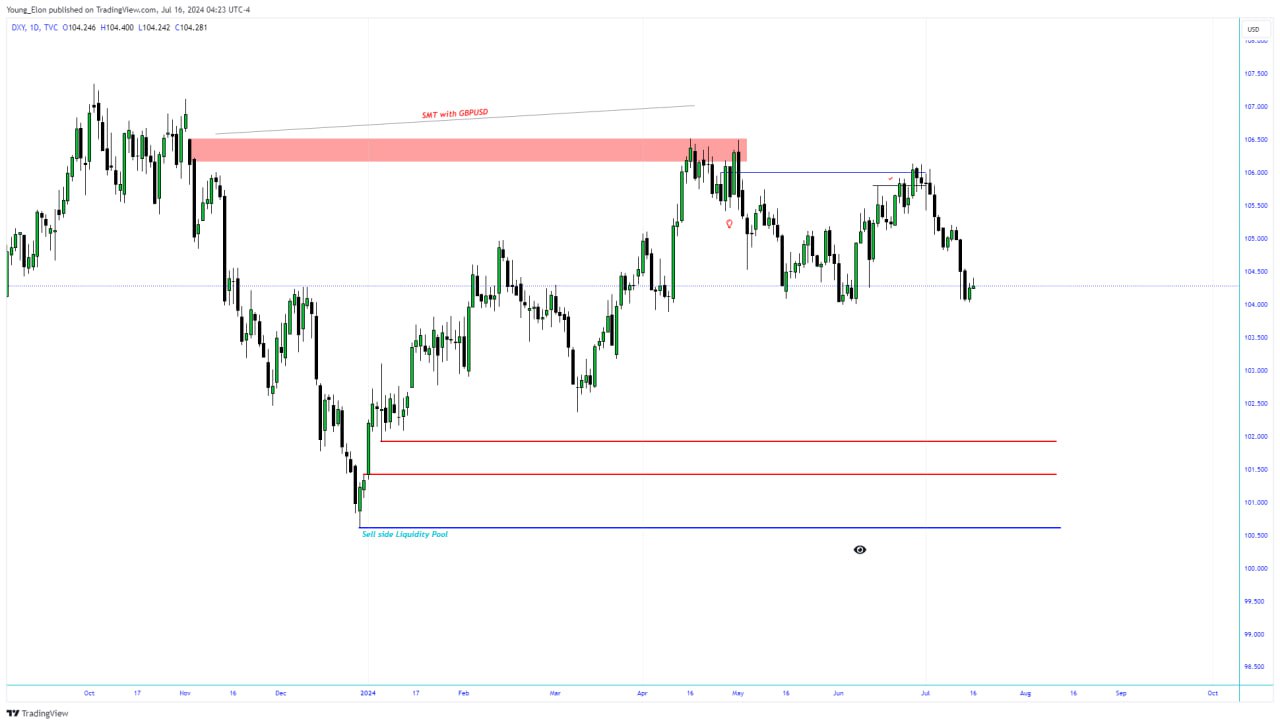
This is a YouTube channel, in which they share the precise models for smart money trading concepts. With the concepts, you can trade like the banks, by following their foot prints. With the models, you are able to see the specific footprints and in return trade like the institutions.
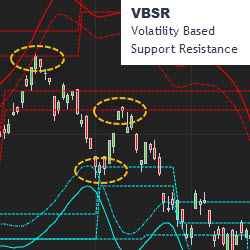
MetaSwing plots the hidden structure of support and resistance in real-time. VBSR (volatility based support resistance) makes this visible in advance, in all timeframes. Markets are non-linear and your tools should be as well. It’s not your father’s TA. Trial MetaSwing.
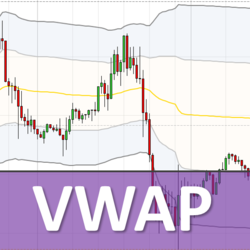
VWAP shows S/R levels, which the majority of institutional algorithms use. It works with all trading instruments (Forex, Futures, Indexes, Commodities, Stocks) and time frames (day trading, swing trading, position trading). It includes VWAP Training Video Course and VWAP trading setups.
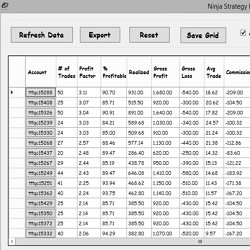
View strategy performance results calculated outside of the NinjaTrader platform. The Strategy Performance tool uses a CPU process separate from NinjaTrader to extract a detailed trade performance summary from Market Replay, Live or Simulated Trading.
With no coding required, StratGen allows the everyday trader to generate strategies. In a couple of clicks, traders can generate strategies with over +1,000 signals at their fingertips. Generate strategies using indicators, price action, time of day, alternate exits and much more.
StockAlgo is a cutting-edge trading signal app tailored for NYSE stock traders, delivering accurate signals for NYSE stocks. Benefit from a 3-day free trial to test its reliability. Available on both iOS and Android, StockAlgo equips traders with timely insights to make informed decisions.
Swing VWAP automatically plots Anchored VWAPs from recent swing highs and lows, taking much of the work out of placing and maintaining anchored VWAPs on your charts.
Join the PFA Community and get the Supply Demand Trading Course, Software licenses, forum access, live training room and more! Monthly, yearly & lifetime license packages available!
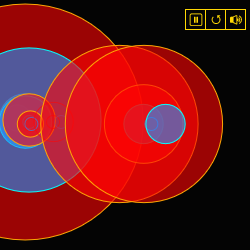
Hear, see and feel the market! A multi-sensory, audio-visual experience of reconstructed trades being executed at every moment. It uses high-performance audio processing technology and an uncluttered visual representation of each trade to give a sense of the pace and size hitting the tape.
December 2, 2024
Mastering Sideways Markets With Auction Bars and Range Projections
November 19, 2024
Enhancing Your Automated Trading System: Key Insights from Best Pro Trade
November 14, 2024
NinjaTrader New Ecosystem Tools: October 2024 Edition
Enter Email for Updates