The PTG Trader Tool Box v1.0 Software Suite includes the full package of ALL 27 Polaris Trading Group Indicators. Discover a wide variety of ways to look at the markets to accommodate and enhance your trading plan.
Trail a stop automatically behind a wide range of indicators: Price Action, ATR, Bollinger Band, Swing, Parabolic SAR, Donchian Channel, or 9 different Moving Averages. Trailing Stop Expert works on Futures, Forex or Stocks. Grab a 7-day free trial now!
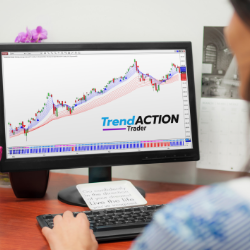
Trend Action Trader keeps you on the right side of the market with clear high probability signals for all markets and timeframes. Its price patterns and momentum algorithm are ideal whether you trade short or long term. Improve your trading consistency - try risk-free for 30-days!
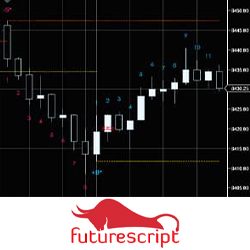
TradingCoders offers custom indicator and automated trading strategy programming services. TradingCoders possesses intimate knowledge of trading and NinjaTrader, and builds projects ranging from simple alerts and visuals, to sophisticated multi-timeframe techniques of price and cycle analysis.
Win-Algo provides strategy programming services on NinjaTrader 8 for traders who want to convert their ideas into automated trading strategies. We help our clients with strategy optimization and algorithm development. Contact Win-Algo if you want to progress as professional trader!
The Price Hacker introduces techniques outlined in the manual to promote the creativity of the user. The hacker section is for identifying sudden shifts in supply and demand, the staircase is used to pinpoint a break in a trend, and the sequence section evaluates the changing of the trends.
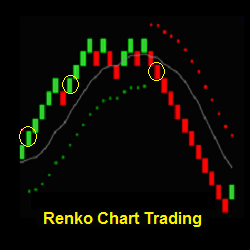
Renko Chart Trading offers day trading strategies, indicators and a training program focused on Renko charts. Learn the characteristics of how Renko charts can emphasize price, help filter chart noise and add clarity to trading. Join the Renko Trading Group today!
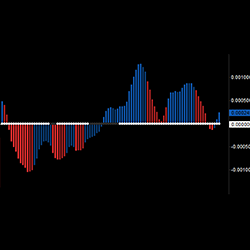
Based on the popular Squeeze, this is a go-to indicator, made up of the Bollinger Bands and the Kelner Channel. It makes the trading consolidation or divergence as easy as 1-2-3. This indicator has a multitude of uses. Get it on your charts today!
Have you ever tried to figure out where to place your profit target to hit your profit goal for the day? Or where to place your stop-loss to avoid max drawdown? Calculate and move your orders in a single click with Quick Trade. Includes commissions and realized P&L.
Learn to code automated strategies, indicators and add-ons for NinjaTrader 8. Join our NinjaScript custom programming course. No prior programming knowledge is required. Learn from beginner to expert level in live sessions tailored for custom NinjaScript programming.
December 2, 2024
Mastering Sideways Markets With Auction Bars and Range Projections
November 19, 2024
Enhancing Your Automated Trading System: Key Insights from Best Pro Trade
November 14, 2024
NinjaTrader New Ecosystem Tools: October 2024 Edition
Enter Email for Updates