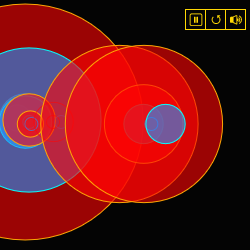
Hear, see and feel the market! A multi-sensory, audio-visual experience of reconstructed trades being executed at every moment. It uses high-performance audio processing technology and an uncluttered visual representation of each trade to give a sense of the pace and size hitting the tape.
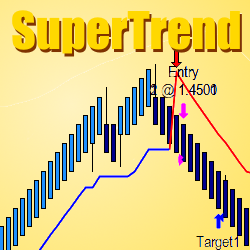
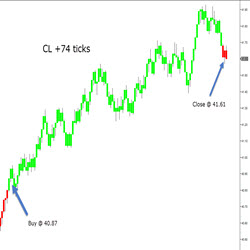
The TIS_Supertrend Indicator is a tool designed to trade volatile markets. The indicator produces 2 types of signals, a trend change arrow each time a trend line is broken and a pullback entry subsequent to the trend change. Download the TIS_SuperTrend today!
Get daily Volume Profile trading levels, monthly swing levels, signals and video! This is a video guide to Trader Dale’s daily levels with access to the member forum. It also includes custom-built Volume Profile indicators for NinjaTrader 8.
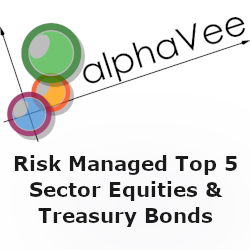
This model balances four separate risk lenses that seek to generate alpha while moderating standard deviation over multi-year periods. Each risk lens is independently applied based on Alpha Vee's breakthrough fundamental momentum research. Contact Alpha Vee for more information.
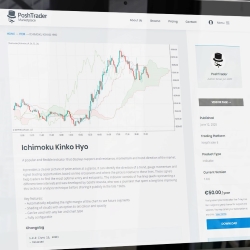
PoshTrader is a fintech company based in Estonia that specializes in custom development and out-of-box solutions for traders. We convert, retain and increase the lifetime value of trading platforms. Our work focuses on enhancing the trader's experience and performance.
Sabertooth Tiger Trading, a dynamic duo of Solar Wind RK and Sumo Pullback$, guarantees optimal entry points with the strongest pullbacks. This comprehensive package ensures high precision, strength, and mastery, empowering your trading journey for huge rewards.
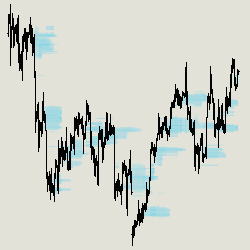
Dynamic Volume Profile is an optimized indicator which represents market profile with live and historical volume data. This strategy and backtest friendly indicator enables users to easily analyze years of historical data and adjust parameters dynamically from both the menu and chart.
Introducing Core Buttons, the ultimate trading tool for split second decision making. These intuitive buttons provide instant access to essential trading functions, enabling you to execute trades, manage positions & adjust orders with a single click. Tailor the customizable options to your trading.
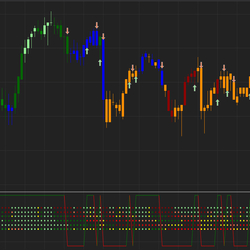
TrendFinder identifies what direction the market is moving. TrendFinder is universal and works with any market and any time interval. When an upward bias is detected, the bars are displayed in Green. When a downward bias is detected, the bars are displayed in Red.
Nordman Algorithms provides indicator and strategy programming services. Indicators for trend identification, trade zone detection, news impact calculation, price pattern visualization & more can be built, as well as extendable, maintainable systems that follow your trade strategy.
December 2, 2024
Mastering Sideways Markets With Auction Bars and Range Projections
November 19, 2024
Enhancing Your Automated Trading System: Key Insights from Best Pro Trade
November 14, 2024
NinjaTrader New Ecosystem Tools: October 2024 Edition
Enter Email for Updates