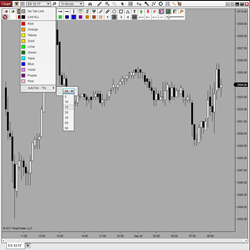
Auto Tab adds a Tab Link Selector to the top left portion of every Dom & Chart window. Simply click on the tab of any window, and all other windows (linked by color) will also change to that same tab! Simulate multiple workspaces with tabs and enable automatic sequencing with a configurable timer.
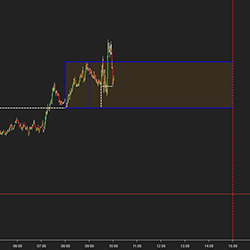
Identify market inefficiencies by marking fair value gaps (FVGs) on the chart that meet predefined size criteria. The indicator distinguishes between bullish and bearish gaps and changes their color once they are inversed. It provides clear visual cues for potential rejection trades from these gaps.
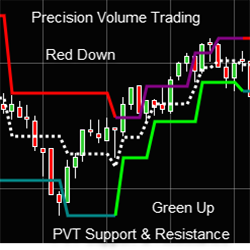
Precision Volume Trading Support & Resistance measures each swing point for traders to know where buyers and sellers are.
With decades of experience, EMS specializes in the creation of custom software for clients worldwide. For over twenty-five years, EMS has been helping our clients reach their goals with honesty, integrity and fairness. Contact us for a complementary consultation.
Bstrader-automatic is a powerful trend following automated trading system. It has customizable parameters, different position sizing methods, fixed size, equity percentage, atr, price percentage, ATR Trailing Stop, Market Money Scale In and Scale Out, Volatility Compass, Daily loss limit and more.
Quintalytics develops custom trading software for retail and institutional traders, brokers and other industry professionals for both NinjaTrader 7 and NinjaTrader 8. We have utilized and developed hundreds of custom indicators and trading strategies over 20 years. We can also modify and optimize.
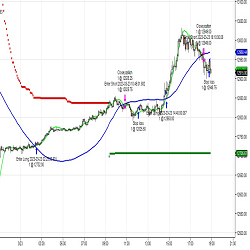
Trail a stop automatically behind a wide range of indicators: Price Action, ATR, Bollinger Band, Swing, Parabolic SAR, Donchian Channel, or 9 different Moving Averages. Trailing Stop Expert works on Futures, Forex or Stocks. Grab a 7-day free trial now!
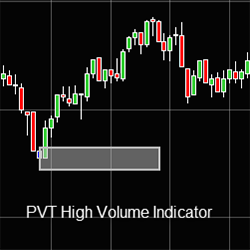
Precision Volume Trading High Volume Indicator lets you know where the volume is being traded to trade with high liquidity.
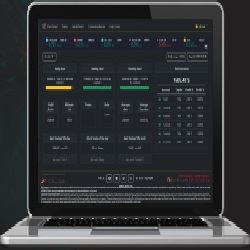
The best risk management dashboard tool, with an intuitive web platform that provides complete control, protection & detailed visualization of the evolution of all trading accounts. Optimized for propfirm trading, our solution is the ultimate choice for traders and teams. Click to learn more!
Add the visual benefit of displaying the session open value (settable). Build a visual range of any timeframe you choose. For example, the first 30 minutes of the market open or an hour before the market opens. Choose the end time for a range to stop displaying for the day.
December 2, 2024
Mastering Sideways Markets With Auction Bars and Range Projections
November 19, 2024
Enhancing Your Automated Trading System: Key Insights from Best Pro Trade
November 14, 2024
NinjaTrader New Ecosystem Tools: October 2024 Edition
Enter Email for Updates