A simple and versatile automated system based on one strategy. The strategy includes a technical management module, indicators, color backgrounds and a comprehensive money management module. All leases include training and support!
This course is designed to get you up and running with strategy design and coding for NinjaTrader 8. It provides the most efficient framework that you can adapt for the architecture of most systems and demonstrates various ways to enter and exit the market using the most standard techniques.
Price action in relation to volume. Studying these variables establishes the equilibrium of supply and demand, as well as the possible near-term direction of the market. Don't just measure volume - measure volume that can anticipate a potential change in trader sentiment!
Elevate your trading strategy with the Volume Levels Indicator. Detecting support and resistance from volume, it delivers precise levels respected by the price. Features include order flow cumulative delta integration, real-time order block detection, an age counter for significance tracking & more.
With decades experience as an active trader & accredited coach, Mandi understands what it takes to build a successful trading career. She specializes in coaching HedgeFund, Prop, Bank & Private Traders around the globe in the essential mindset aspects of trading.
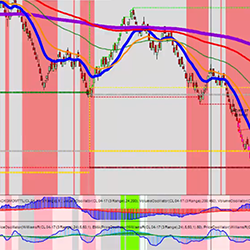
This cutting-edge indicator harnesses the power of Volume, Ranges, and an array of other metrics to pinpoint Key market levels. Brace yourself for a revolutionary approach that goes beyond mere pivot points. This indie is ideal for trading breakouts and reversals. Also efficient at setting PT & SL.
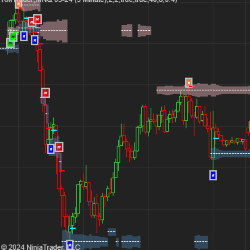
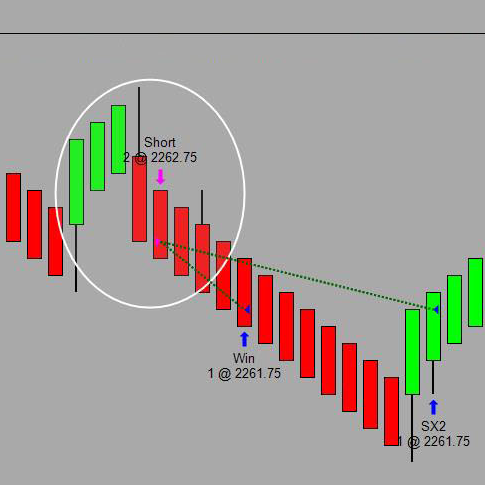
Recently updated, the Conway Market DNA Day Trading System now includes Auto Strategy Trade Entry and Exit and a simplified Order Flow which projects 1 bar into the future. Also included is our Chop Filter Indicator, which will not take trades in a choppy market, and a 236-page product manual.
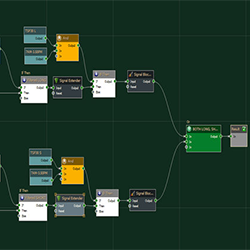
Custom strategy design in BloodHound. Remek! will program your trading strategy as per your specifications and requirements. Learn more!
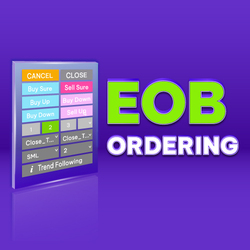
EOB or End Of Bar is an amazing close-bar order tool that is nowhere else to be found. This amazing add-on works with any bar types. Let EOB Ordering play the tough game for you, as it was designed to reduce the ordering time to just a few milliseconds.
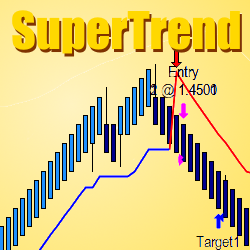
The TIS_Supertrend Indicator is a tool designed to trade volatile markets. The indicator produces 2 types of signals, a trend change arrow each time a trend line is broken and a pullback entry subsequent to the trend change. Download the TIS_SuperTrend today!
December 2, 2024
Mastering Sideways Markets With Auction Bars and Range Projections
November 19, 2024
Enhancing Your Automated Trading System: Key Insights from Best Pro Trade
November 14, 2024
NinjaTrader New Ecosystem Tools: October 2024 Edition
Enter Email for Updates