If you seek a trend-following system capable of minimizing failed entry signals in choppy markets, your search ends with RK-System Platinum v4. This system provides up to 4 signal types, with the price action signal type proving to be particularly reliable and productive in our backtesting.
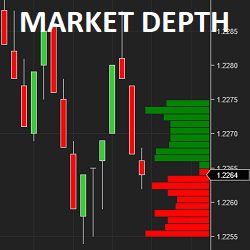
itcMarketDepth is an indicator used to read depth of market data. Reading the depth is useful to qualify key support & resistance levels. This helps traders to know if a level will hold or break. itcMarketDepth can be customized by color, size of bars, filter, number of elements to display & more.
Daily Levels plots important levels such as prior days open/high/low/mid/close, overnight high/low/mid, IB high/low and more! It also displays historical probabilities of price touching each level in regular and overnight sessions for the most popular futures products.
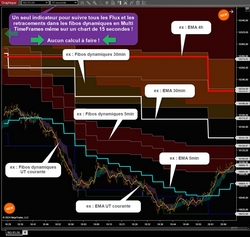
This indicator will calculate for you in multi timeframe: 4 EMA MTF + 4 “SunjoKu” MTF, the famous indicator invented by Joël Mathieu the boss of Intrad. Since version 1.5: A summary table of the status of the different TimeFrames has been included.
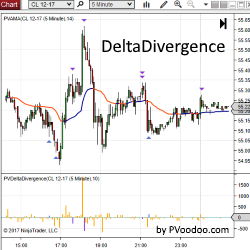
PVDeltaDivergence Indicator is a powerful tool designed to help traders identify possible turning points in their favorite markets with order flow analysis. Get a free trial of PVDeltaDivergence for NinjaTrader today!
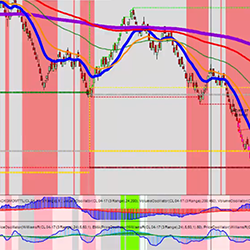
A simple and versatile automated system based on one strategy. The strategy includes a technical management module, indicators, color backgrounds and a comprehensive money management module. All leases include training and support!
Welcome to the 7 Steps for Consistent Trading Performance. This free 7-day video course teaches about the three strategy stats based on probabilities to help you build a sustainable, scalable and reproductive (SSR) strategy for achieving consistent performance.
Free trading psychology masterclass. Learn the complete trading psychology system to overcome destructive trading habits and reach pro-level consistency in as little as 8 weeks (even if you are starting with zero willpower and breaking your rules every time you trade). Register today!
The Jurik Volatility Bands can be used for entries for trends by using the zero line crosses whilst counter-trend trades can be made once the oscillator line is close to the outer bands. It works in range-bound and trending markets.
The Volatility Index (VIX) is a real-time market index that represents the market's expectation of 30-day forward-looking volatility. The VIX moves inversely to the indices and is often used as an indicator of upcoming market moves to time precise entries and exits. AKA Fear Gauge or Fear Index
December 2, 2024
Mastering Sideways Markets With Auction Bars and Range Projections
November 19, 2024
Enhancing Your Automated Trading System: Key Insights from Best Pro Trade
November 14, 2024
NinjaTrader New Ecosystem Tools: October 2024 Edition
Enter Email for Updates