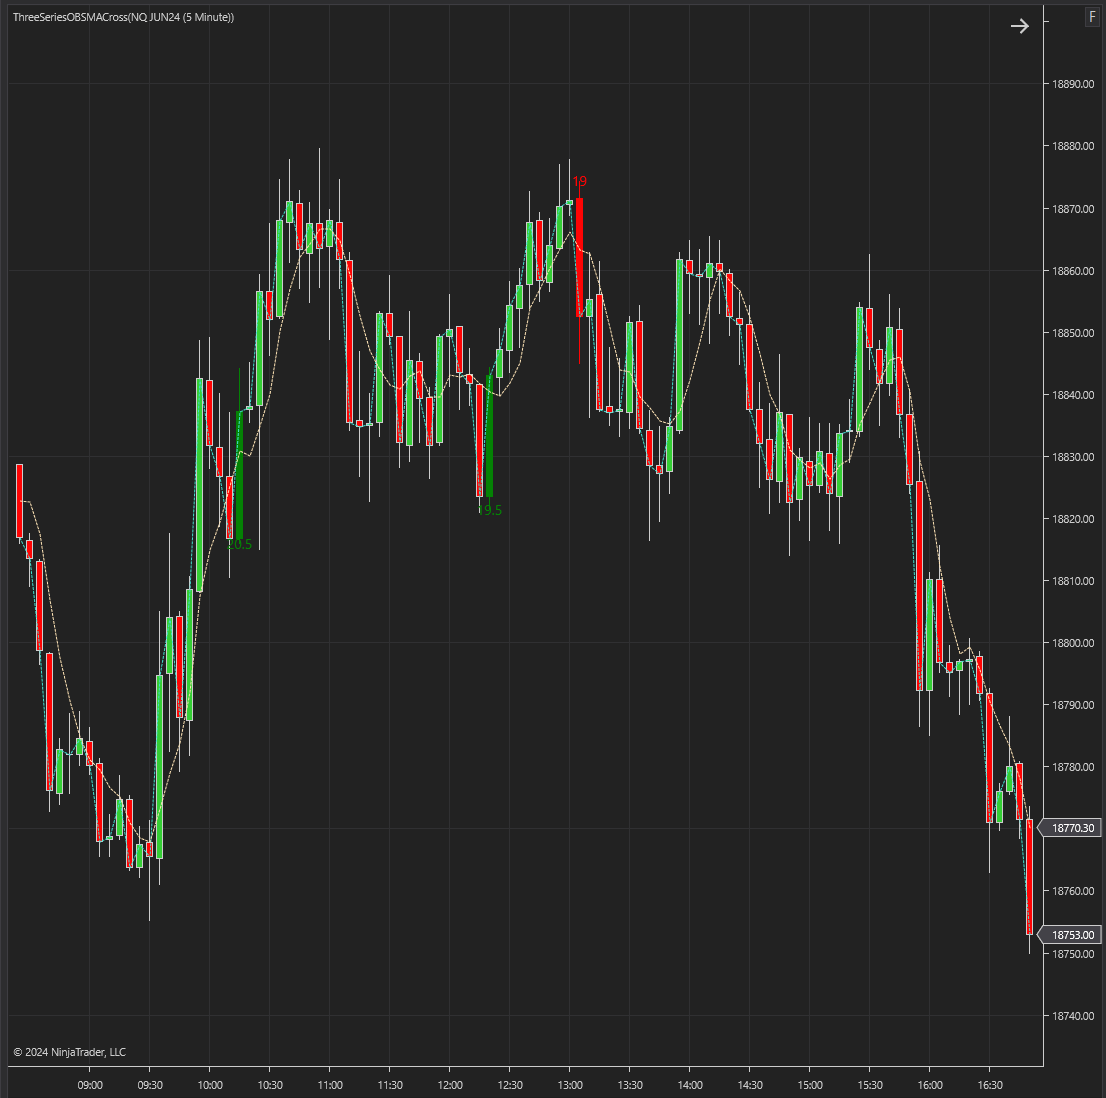
This Indicator is a sophisticated tool designed to help traders identify and capitalize on bullish and bearish market trends. By combining Simple Moving Averages (SMA) and engulfing pattern detection, this indicator provides clear and actionable signals for entering and exiting trades.
SpeedyAlert is a free tool that sends you an email notification if a running application crashed, stalled or is short on RAM & other critical resources. This is a very useful tool for PC’s hosting 24/7 automated strategies. Avoid these not so funny “surprises” & download SpeedyAlert today!
Try our fully-functional, ready-to-use automated trading strategy for NinjaTrader 8 at no cost for 14 days. Designed for the futures market, it has been thoroughly backtested, needs no adjustments, & is suitable for Micro/Mini markets. Full support and templates are included during your free trial.
TradesViz is an advanced online trading journal. Auto-sync with NinjaTrader and Tradovate. It includes auto-plotted executions on charts and more than 300 statistics, including MFE, MAE, best-exit analysis and more! Auto-sync with brokers and discover your trading edge!
You can draw the risk/reward roulette tool at any point on a candlestick chart simply by clicking on the chart with the middle mouse button. This indicator allows you to speed up the drawing of the risk/reward tool on the chart by times, expanding on the functions of the trading platform.
We are professional NinjaScript developers with more than 20 years of experience. We develop custom-made indicators, addons, drawing tools, market analyzer columns, automated strategies and much more. Contact us now and receive a free quote!
Trading coach with volume and price indicators.
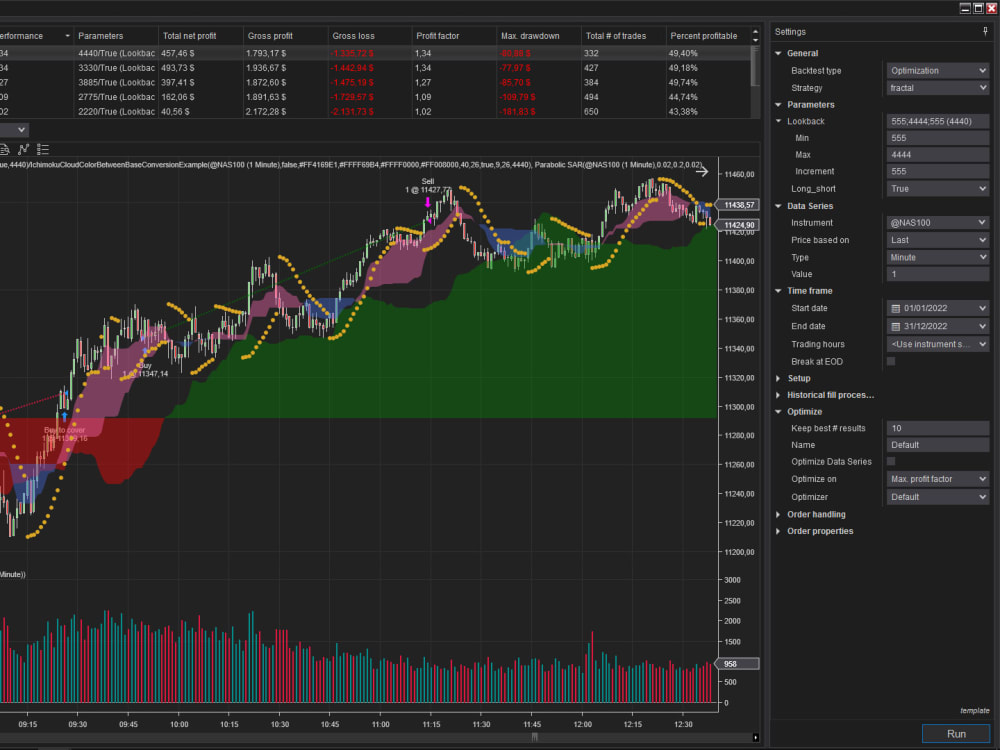
This is a fractal trading strategy for NinjaTrader 8 that uses Ichimoku as well other indicators for confirmation. It’s running on the latest version of NinjaTrader.
No need to stare at the chart and wonder or make guesses - the Raptor will tell you! The Raptor detects potential trades for you out of the box and will alert you when these trades are setting up. This gives you plenty of time to get into the market with zero stress.
Chompsky Bands: Single and second entry reversal signals and momentum signals, including MACD V5 signals. Includes min/max Bars Per Minute (BPM) filter, Trend Resilience, EMA Tick Separation Filter, Wave Counter. Signal outputs and customizable tags.
December 2, 2024
Mastering Sideways Markets With Auction Bars and Range Projections
November 19, 2024
Enhancing Your Automated Trading System: Key Insights from Best Pro Trade
November 14, 2024
NinjaTrader New Ecosystem Tools: October 2024 Edition
Enter Email for Updates

 from Indicator Warehouse.png)