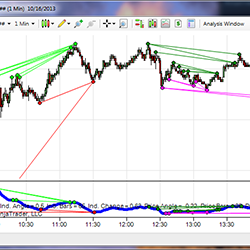
PriceIsKing.com's Stocks RAM Indicator is a powerful tool based on years of research and testing that shows equities traders entry points with arrows when the right condition is met. Get started with a free 2-week trial today!
The Divergence Indicator for NinjaTrader utilizes a sophisticated algorithm to detect divergence, and eliminates some shortcomings of typical divergence indicators. It can be calculated using any indicator within NinjaTrader (ex. RSI, MACD, Stochastic, or any custom indicators).
Transform your trading with 'Trading Psychology Toolkit' – a concise guide offering 23 practical strategies to master trading psychology. Developed from real world experience and scientific methods, it's an essential tool for emotional control and strategic thinking in trading.
The Session Delta Pivot monitors the aggressive auction participants within a given session. By mapping this type of activity, the user can gauge the potential location for initiative activity as well as develop an understanding of directional day types.
This product is a automated bot strategy that work on NQ and MNQ only.
All-in-one solution for futures traders, including powerful order flow reversal signals, daily trading plans, live morning voice chat/trading, in-depth courses on our strategy and the mental aspects of trading. It's everything you need in one place to develop your skills.
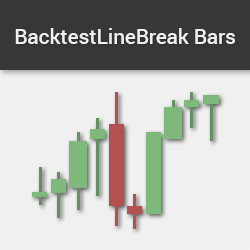
The Line Break Bar is one of the most effective ways to reduce chart noise. It provides accurate back-testing results by showing the correct open prices and restoring the wicks. Easily recognize divergence & price action patterns & eliminate noise from traditional minute charts. Get started today!
The Volume Weighted Average Price (VWAP) tells traders the average price for all transactions executed during a trading session, such as the current day, week, month or quarter. Many institutional traders execute based on the VWAP, so it is an important price benchmark to control transaction costs.
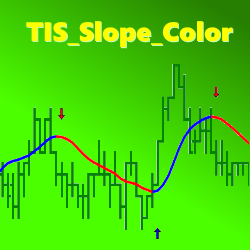
The TIS_Slope_Color indicator allows traders to detect the slope change of any line from any indicator. It can then paint the line, the background, or paint entry signals on a chart.
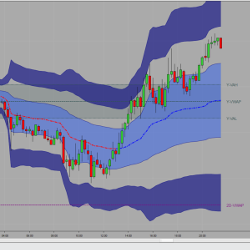
CB ZoneChart V4 is a longer-term day trade indicator that shows support and resistance, fibs and opening range areas. It has many settings and has been updated over the years (since 2016). Combining it with the other CB Indicators makes a great combo. Try it out with a 14-day free trial!
December 2, 2024
Mastering Sideways Markets With Auction Bars and Range Projections
November 19, 2024
Enhancing Your Automated Trading System: Key Insights from Best Pro Trade
November 14, 2024
NinjaTrader New Ecosystem Tools: October 2024 Edition
Enter Email for Updates