The Wealth Builder’s Roadmap is a step-by-step process divided into distinct phases. The five Ps featured in The Wealth Builder's Roadmap cover each essential pillar needed for a rock-solid trading plan. The coaching program includes online training and one-on-one follow up sessions.
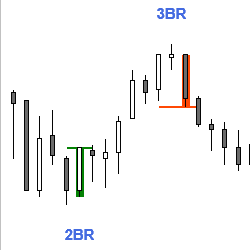
This indicator identifies 10 different signal bars or patterns for possible reversals by examining bar features and relation to prior bars. It can be used as a discretionary indicator or for automated (e.g. BloodHound) trading. Get started with a free 20-day trial today!
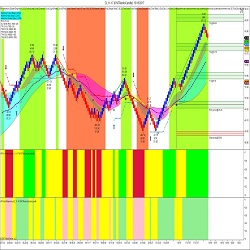
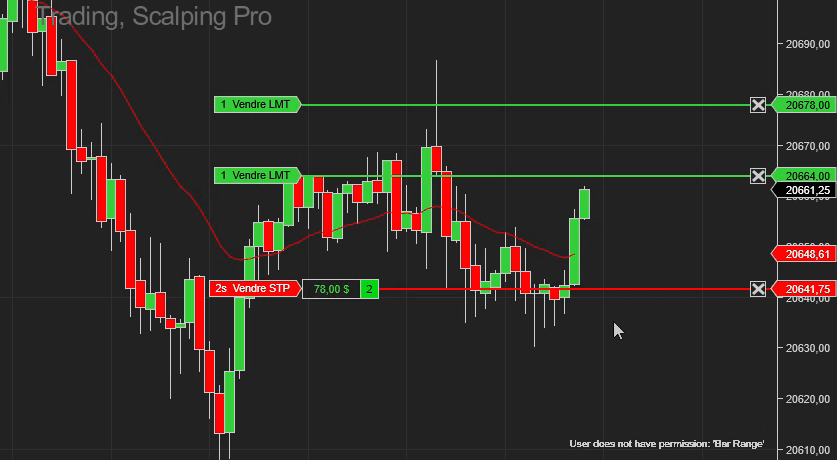
The HTS Master 2.0 is a trading solution that incorporates volatility and order flow to generate automated signals for scalping and trend following. The HTS commitment includes unlimited trading room access, private mentoring, & unlimited upgrades. Trade in Harmony now with a 2-week free trial.
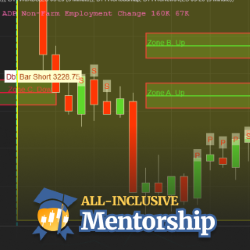
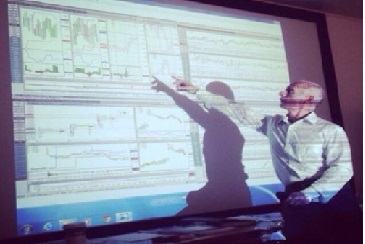
Become a pro trader via an eight-week trading school. All courses & software are included. Receive live training from a coach who teaches you over 10 price action methods & how they work together to form a complete plan for daily trading. Learn the exclusive Roadmap & Blueprint techniques.
On this YouTube channel, discover complete demonstrations to master NinjaTrader, price action, technical indicators, money management, and Japanese candlesticks. Improve your trading skills with practical tutorials and advanced strategies.
PriceIsKing.com's Stocks RAM Indicator is a powerful tool based on years of research and testing that shows equities traders entry points with arrows when the right condition is met. Get started with a free 2-week trial today!
Q-GZone provides visual gap zones between the bars. Gaps occur when a significant imbalance exists between buy and sell orders. It can lead to a gap in the price as the market seeks to match these orders. The market tends to return to and fill in these gaps.
This masterclass delivers on all fronts, providing all the fundamental knowledge and practical trading skills required to trade any asset class and in any market conditions. This course is designed specifical for those committed to making trading their career. Diploma plus gain your trading skills.
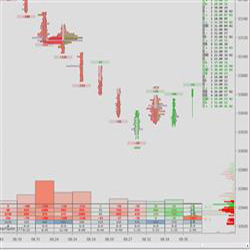
An easy-to-use order flow and volume profiling tool for NinjaTrader 8. The goal is to present order flow in a simple, clear way that also performs well in volatile markets. Numbers are not key here, visuals are. Algo helpers and trade execution assist included. Always evolving! Trial available.
FXAN delivers a full approach that combines institutional tools, education, and professional support to help you trade with confidence. Their algorithms and training program have been developed by trading experts who’ve dominated markets for years.
December 2, 2024
Mastering Sideways Markets With Auction Bars and Range Projections
November 19, 2024
Enhancing Your Automated Trading System: Key Insights from Best Pro Trade
November 14, 2024
NinjaTrader New Ecosystem Tools: October 2024 Edition
Enter Email for Updates