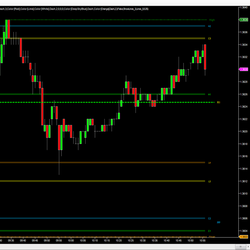
The DTB Trading Lines indicator conveniently plots (1) Standard pivot points (2) Last 5 days highs, lows, and closes, (3) Todays open price (4) High and low of current day.
If you're serious about learning to trade forex, this is the program for you. It includes all the knowledge and tools you need to succeed as a forex trader, and all taught in live markets with two seasoned traders. So grab your seat now, and start trading with confidence.
Universal Oscillator is an indicator that operates on the general principles of the RSI, CCI and OsMA oscillators. It helps you to identify potential upcoming reversals based on the values of the oscillator.
Ultimate Support and Resistance Suite provides precise support and resistance lines and zones to trade any market on any time-frame. This tool enables you to accurately determine which supply and demand price levels require your attention. Use it as a standalone indicator or enhance any system.
PriceIsKing.com's Futures RAM Indicator is based on a powerful moving average pattern recognition algorithm developed with years of research and testing. Get started with a free 2-week trial today!
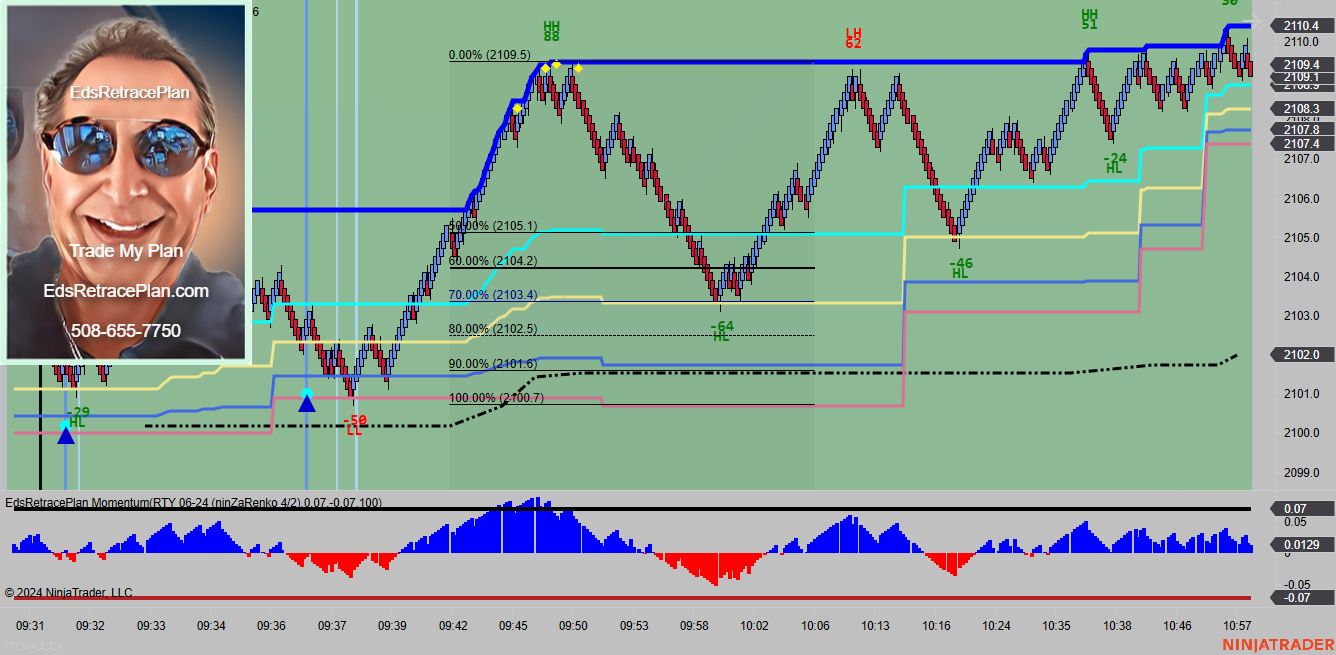
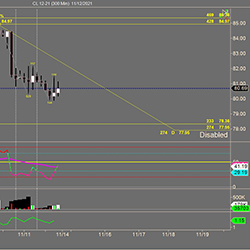
EdsRetracePlan Momentum Reversal Indicator is for day trading ES, YM, RTY, NQ, CL and GC. The indicator identifies reversal trades by finding and marking tops and bottoms. These trades signal the end of a move and opportunities to get short at the highs and long at the lows.
Experience first-hand how Touch Zone Trading identifies opportunities & manages trades. Whether you’re trading part-time or full, you’ve got to be ‘in the zone’ to perform. Are you a good fit for the Touch Zone Trade Room? Take the trader survey!
Forex Trading Unlocked Online Trading Mentoring provides focused consulting to suit each individual trader’s needs. Forex, futures, stocks, options, and binary options traders can all benefit. Your trading will be placed under a microscope to help eliminate what is holding you back.
This Order Flow indicator package takes the information overload out of interpreting complex footprint charts and volume data by doing the calculations internally, and then plotting easy to read objects on the chart. Your membership includes the software, one month trade room access and mentorship.
Learn to trade using a proven righthand trade method by trading two hours a day. 20 hour-long face-to-face sessions. Sessions are captured on video for repeat viewing. Includes candle patterns, harmonics, geometry and an intro to forecasting.
December 2, 2024
Mastering Sideways Markets With Auction Bars and Range Projections
November 19, 2024
Enhancing Your Automated Trading System: Key Insights from Best Pro Trade
November 14, 2024
NinjaTrader New Ecosystem Tools: October 2024 Edition
Enter Email for Updates