ET 8 includes all the features of ET 7 plus the ability to plot trade history. Determine the strength of prior market highs and lows by understanding if they were set from large or small trades to confirm whether large traders are participating in the current market action. Free 2 week trial.
This algorithm calculates the support and resistance based on a look back period (number) of candles or bars and determines the support and resistance levels dynamically.
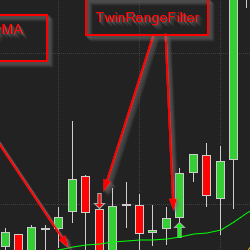
The Twin Range Strat employs two indicators (the Twin Range Filter and the RedKSmoothAndLazyMA) to genterate ATM Orders. The quantity, stops and trailing are all handled by the ATM and you, if you like!
Our Stock Trading Package includes pre-built workspaces, chart templates and Market Analyzers with scanners and alerts. Use ATS Chart Trader for trade management, ATS Inflection Point indicator for daily inflection points and use DTS Ichimoku Cloud Pattern for trade setups. Education is included!
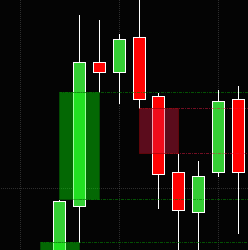
A cutting-edge indicator designed to make order flow trading both effective and enjoyable. Featuring an intuitive footprint chart, it provides valuable insights into historical and real-time market activity. The footprint chart reveals buy and sell volumes and order flow within each price bar.
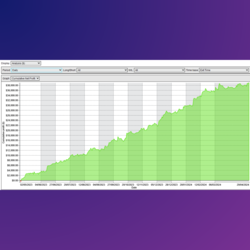
Scalping: Takes fast and precise trades. Dual-Exit Strategy: Take Profit and Stop Loss. Finds patterns in the data and defines probabilities. Choose the number of contracts. Optimize parameters and adjust your trading style. Works in the NQ and GC futures contracts.
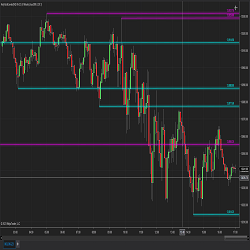
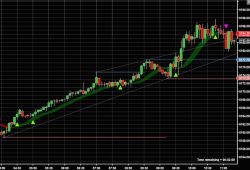
Trend Support & Resistance works great as a companion to the Trend Ribbon & Buy/Sell indicators. This indicator identifies support & resistance levels plus forecasts highs / lows. Helps you predict upcoming reversals with confidence. Adjust to your style of trading: intra-day, swing or longer.
The Ichimoku Mentoring Program contains 4 weeks of pre-workshop webinars, a live 2-day boot camp, 2 months of post course mentoring, access to the trade room & Ichimoku research center. Learn more!
Market Analyzer 96 Trade Systems is a framework of 96 easy-to-use trade systems to test market conditions. With this course you will be able to extend the provided framework and use it as a powerful tool for building trade systems.
ICT's Fair Value Gap indicator retains a configurable number of gaps, and there's a setting to remove those that have been crossed by price. The style of the rectangle and the rays from the gaps are customizable by creating a template for a rectangle named "FVG Up Gap" (for the Up gaps).
December 2, 2024
Mastering Sideways Markets With Auction Bars and Range Projections
November 19, 2024
Enhancing Your Automated Trading System: Key Insights from Best Pro Trade
November 14, 2024
NinjaTrader New Ecosystem Tools: October 2024 Edition
Enter Email for Updates