PriceActionPivoter is a fully automated trading system that uses price action and pivot points to execute trades. Primarily designed for ES/MES, but you can trade anything on it. This trading system also offers money management settings so you can have full control over every aspect of your trading.
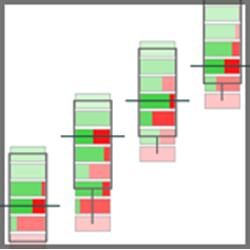
LogikBarProfiler is a feature-rich bar volume / tick / price distribution heads-up display analysis tool. It displays data computed within each bar, as well as buyer v. seller distribution at price levels. This combines the usefulness of POC, delta, and activity analysis into one intuitive tool.
Know that you’re an amazing trader but finding the funds to get started is the one thing standing in your way? At UProfitTrader, we can help! Simply choose the size account you’d like, show us what you’ve got through our unique testing process, then start turning your passion into a profession.
Price action in relation to volume. Studying these variables establishes the equilibrium of supply and demand, as well as the possible near-term direction of the market. Don't just measure volume - measure volume that can anticipate a potential change in trader sentiment!
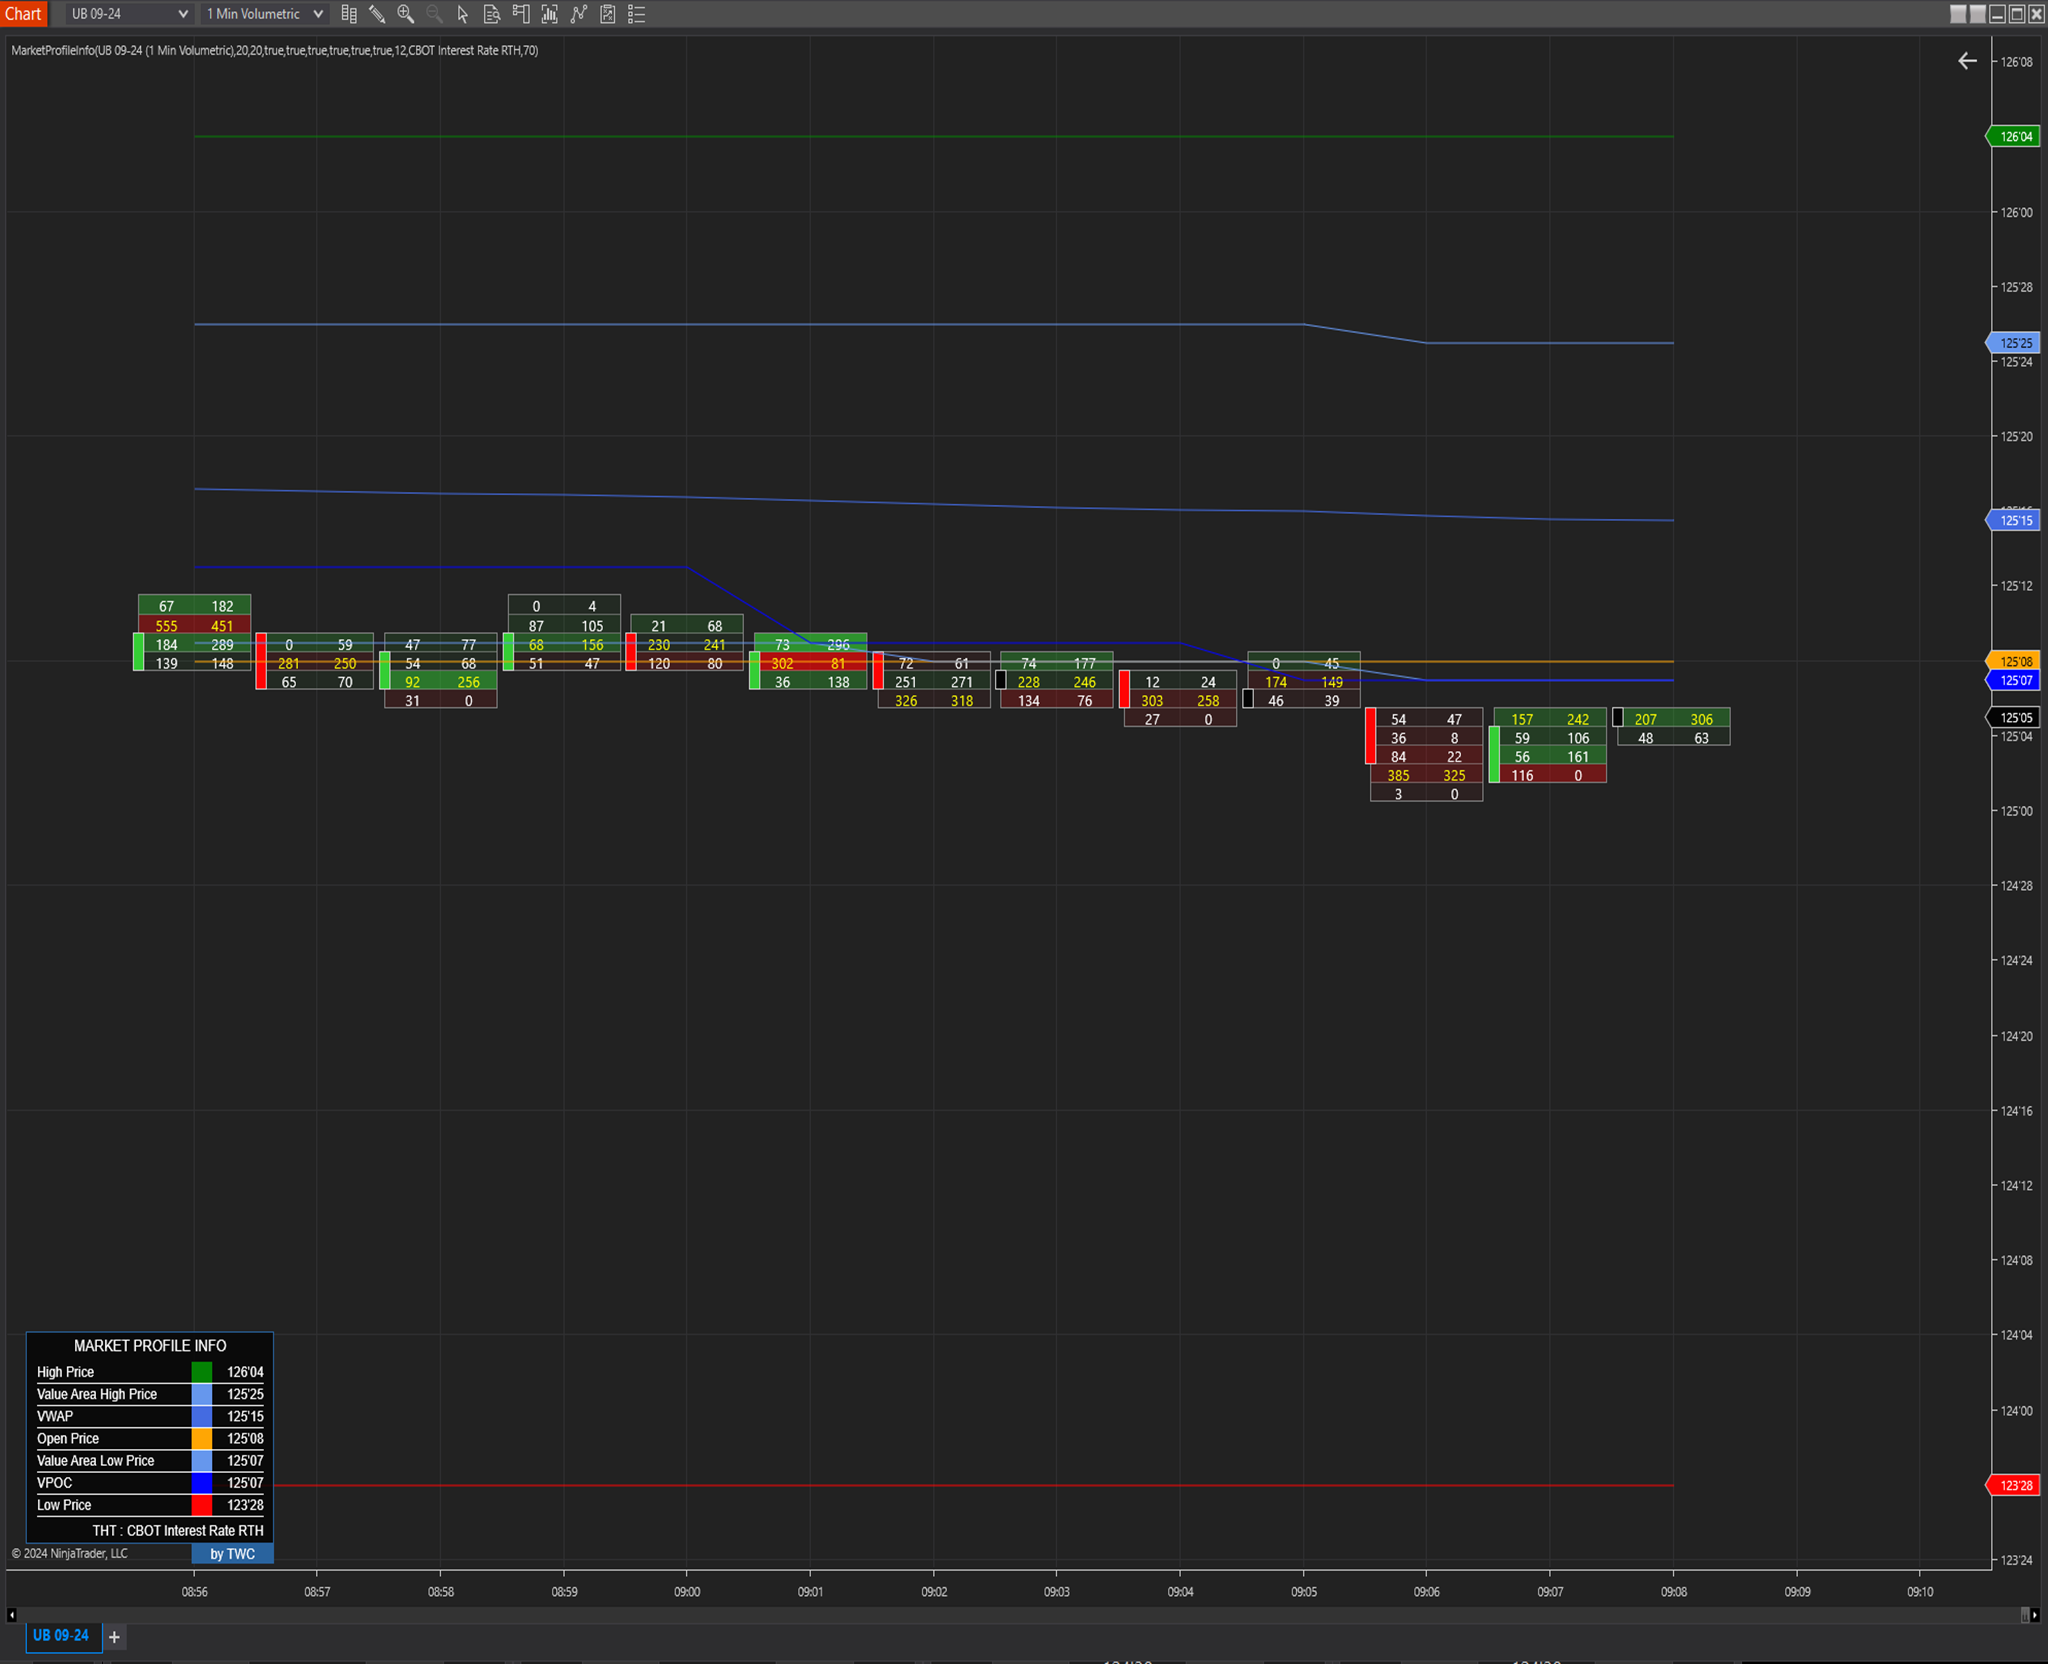
TWC Market Profile Info provides key points on the market profile that are constantly updated in real-time, including the high price of the day, value area high, volume Point of Control (POC), Volume Weighted Average Price (VWAP), value area low, and the low price of the day.
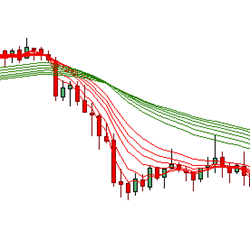
The Fanned Multiple Moving Average day trading indicator uses two sets of moving averages (long and short term) to calculate the probability of trend development, change, and direction. The FMMA reveals the nature of the trend and trend changes, which often reveals the starting point of a breakout.
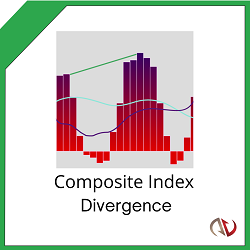
See trend reversals before they happen with intelligent divergence signals! Predict the trend ahead of the crowd with precise entry and exit points. This innovative indicator uses momentum calculations to warn of trend reversals before they happen!
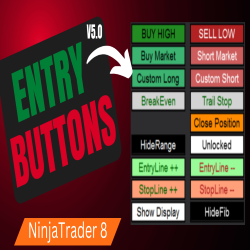
Automatically calculate your position size, stop and profit target. These buttons set your entry at the High/Low of the candles selected. You can also use our buttons to enter a Market Order and even customize your own set of order entry buttons. Set a breakeven (2 options) or set a trail stop.
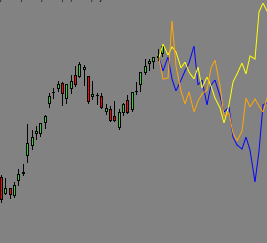
This drawing tool provides insight into future price movements by projecting the previous three years data forwards in simple to read color-coded plots. No guessing, no predictions, just the reality of what happened before. Expensive product for the serious trader.
Introducing Core Buttons, the ultimate trading tool for split second decision making. These intuitive buttons provide instant access to essential trading functions, enabling you to execute trades, manage positions & adjust orders with a single click. Tailor the customizable options to your trading.
December 2, 2024
Mastering Sideways Markets With Auction Bars and Range Projections
November 19, 2024
Enhancing Your Automated Trading System: Key Insights from Best Pro Trade
November 14, 2024
NinjaTrader New Ecosystem Tools: October 2024 Edition
Enter Email for Updates