See floor trader pivots like never before! Optimal Pivots shows percentage market touch-rates for every pivot level for ES, NQ and YM, backtested over ten years. Also see end-of-day close rates for each pivot zone, plotted on your chart at today's open. Bring market statistics to your trading!
Become a pro trader with our 26 chapter Price Action Trading Course. Step by step guides showing you how to find signals, set up your chart,find trends,when & when not to trade & much more. Includes lifetime membership,live daily analysis,chatroom & weekly analysis video sent directly to your inbox.
The Linear Regression Channel (LRC) is designed to truly detect when prices are overbought or oversold. Different than other LRC indicators, the width of the Stealth Traders LRC channel is based on a proprietary formula, designed to pinpoint opportune entry and exit signals. Upgrade Your LRC Today!
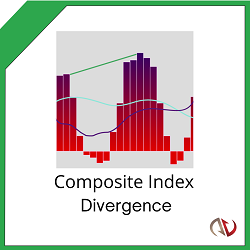
See trend reversals before they happen with intelligent divergence signals! Predict the trend ahead of the crowd with precise entry and exit points. This innovative indicator uses momentum calculations to warn of trend reversals before they happen!
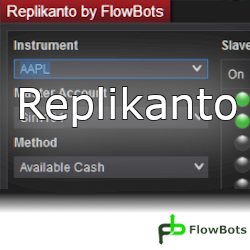
This is an order replication add-on between accounts. It replicates orders from a Leader Account to multiple follower accounts according to the replication method selected. There are several replication methods, each with its own functionality. It replicates orders in both NinjaTrader 7 & 8.
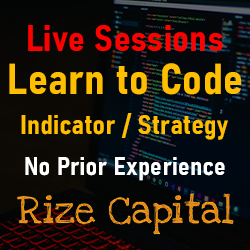
Learn to code automated strategies, indicators and add-ons for NinjaTrader 8. Join our NinjaScript custom programming course. No prior programming knowledge is required. Learn from beginner to expert level in live sessions tailored for custom NinjaScript programming.
Share Service in NinjaTrader 8 is a secure file sharing platform specifically designed for the NinjaTrader 8 trading platform.
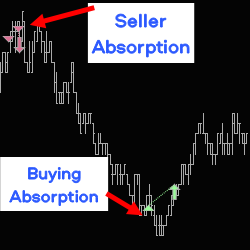
Absorptions are announced in real time with audible alerts and/or drawings on the chart. It also analyses backticking following absorptions. Adapt your trading zone live, with a toolbar on the chart. Strategy builder compatible.
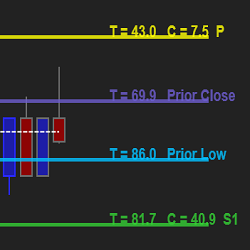
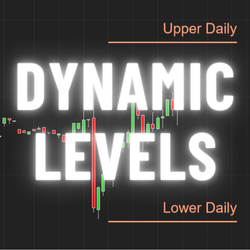
Dynamic Market levels calculated by Scalp Radar. The first market level provided by this indicator is the daily, weekly, monthly, and quarterly expected move. Based on the options market, these levels provide crucial insights into the estimated price ranges for popular symbols such as SPY and QQQ.
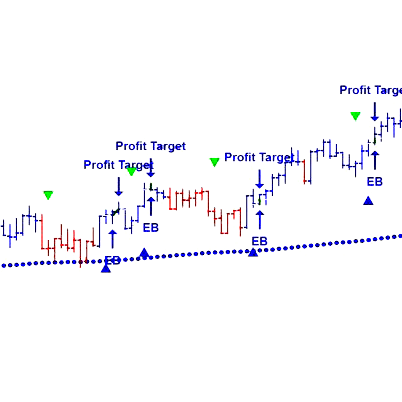
This fully-automated reactionary price and volume intraday trading strategy takes advantage of fluctuations of price, direction and momentum to currently trade the E-mini indices. We will be expanding into other futures, commodities and chart intervals in the near future.
December 2, 2024
Mastering Sideways Markets With Auction Bars and Range Projections
November 19, 2024
Enhancing Your Automated Trading System: Key Insights from Best Pro Trade
November 14, 2024
NinjaTrader New Ecosystem Tools: October 2024 Edition
Enter Email for Updates