Predict the ultimate stop level using the sophisticated NSR Triple STX, which performs over a million calculations per bar. Measure the trend strength using the non-arbitrary Ocean math with the BTX indicators. Includes Ocean Classic. Sign up for a 30 day free trial!
The Anchored VWAP package for NinjaTrader 8 includes the Anchored VWAP drawing tool and indicator. With one click, add a VWAP from any bar on your chart. Using the Anchored VWAP indicator, attach orders to the VWAP to automate your trade entry.
Larry Cheung’s investment community provides investment research regarding U.S and Chinese macroeconomics and company-specific fundamental analysis. He also uses technical analysis and order flow to best understand risk/reward for entries and exits across different timeframes.
ChartIdentifier renders instrument information directly on the chart to assist with easy chart identification. Choose what instrument format you want to display and optionally add a prefix value.
Become a pro trader with our 26 chapter Price Action Trading Course. Step by step guides showing you how to find signals, set up your chart,find trends,when & when not to trade & much more. Includes lifetime membership,live daily analysis,chatroom & weekly analysis video sent directly to your inbox.
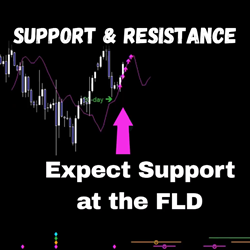
Perform an expert Hurst cycle analysis on any instrument/timeframe chart, and gain insight into hidden levels of support & resistance with accurate targets. Interactions between price & the Future Line of Demarcation (FLD) are identified for you, enabling anticipation of price action ahead of time.
A traditional Gann Fan with 5 next-gen features to give your Gann analysis a new edge. This multi-timeframe Gann fan is what WD Gann himself would have created if he existed in today's fast paced digital landscape. A must to find support and resistance, real-time price momentum & geo signatures.
These are some free indicators that can help you gain an easier and more informed understanding of your trades. Risk calculator, easy entry, volume bar and trend indicators all may help you to avoid mistakes.
The Arnaud Legoux Moving Average (ALMA) is a powerful technical indicator designed to improve the accuracy of moving average calculations. ALMA indicator is an advanced variation of traditional moving averages that aims to reduce lag and noise while providing better responsiveness to market changes.
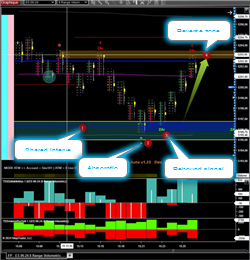
Quality: ✅ Created by Johnny, a developer and trader for his own trading. ✅ More than ten powerful signals clearly codified and documented. ✅ Automatic creation of algorithmic zones. ✅ Use possible even without knowing the footprint. ✅ No risk of the graph freezing due to the tickreplay mode.
December 2, 2024
Mastering Sideways Markets With Auction Bars and Range Projections
November 19, 2024
Enhancing Your Automated Trading System: Key Insights from Best Pro Trade
November 14, 2024
NinjaTrader New Ecosystem Tools: October 2024 Edition
Enter Email for Updates