ABC Trader is for the more advanced and discretionary trader looking for consistency. This easy-to-read indicator helps to identify trades. It includes a predesigned workspace, ready-to-use ABC Rules, and advises what to expect from the markets.
The Emet Trading Solutions team of experienced programmers specialize in converting existing indicators, strategies or code from cAlgo, MetaTrader, TradeStation & MultiCharts to NinjaTrader 7 or NinjaTrader 8. Get a free quote for your project today!
The E.G. Academy Program offers various educational services and tools; customers purchasing the E.G. Trigger Point (annual plan) enjoy the E.G. Futures Trading Course lifetime access for free, and a free trial for the E.G. Price Action Bot.
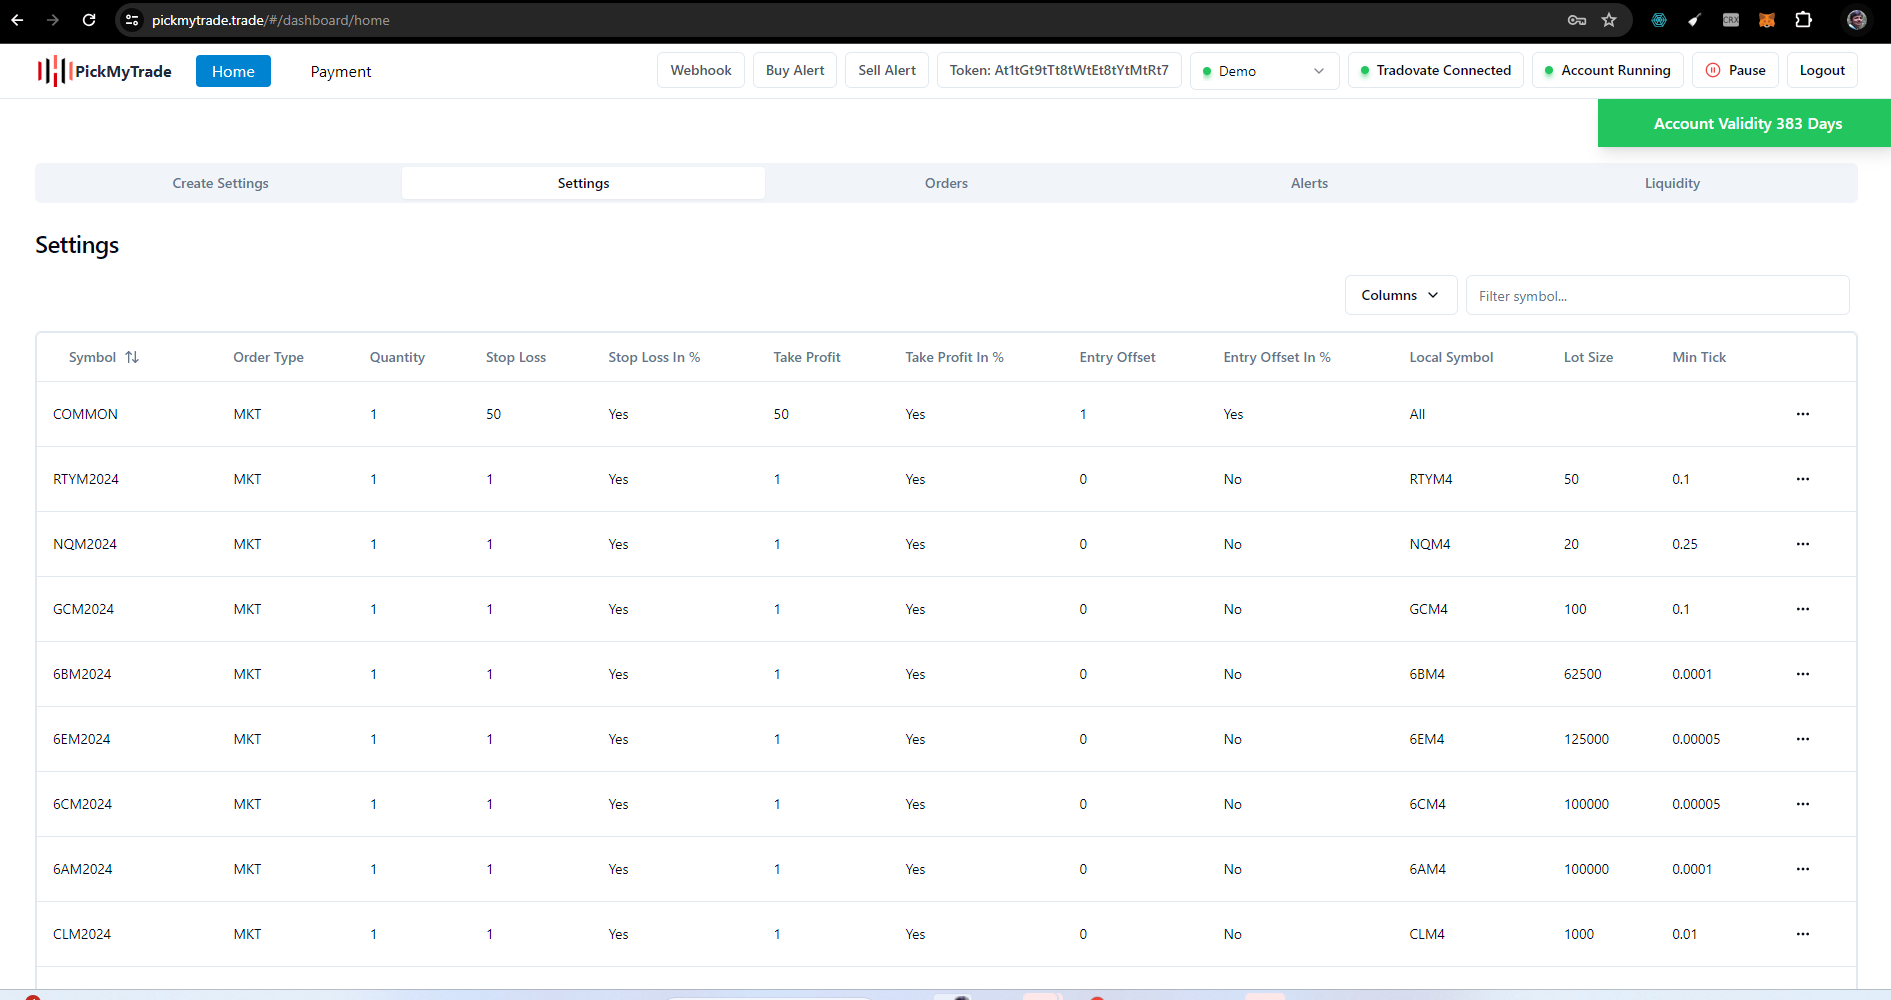
PickMyTrade specializes in automating trading bots, enabling seamless strategy execution for futures across well-known brokers such as Tradovate.
The Tradesight Plus Mentorship is a six-month training program that teaches traders everything they need to know about stocks, futures, options, and Forex. It includes hours of recorded material, plus private mentoring sessions, trade blotter reviews weekly, and access to a live Trading Lab.
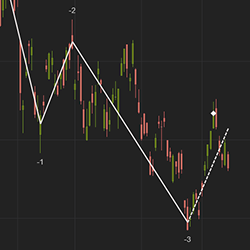
The Wave indicator is similar to an Elliot Wave with an added capability to forecast a possible market reversal. It has convenient features including the ability to number waves to help identify trend direction.
Earl's ultra-configurable HAMA indicator not only smooths out price data, but it excels at helping you spot divergences and leading momentum swings with an "RSI Filter" setting. Trade with more confidence and less hesitation with the included Trend Trigger indicator to help time your entries.
Elevated trading with precision and autonomy. Trade smarter, hands-free! Does not activate everyday as it is looking for specific market opportunities.
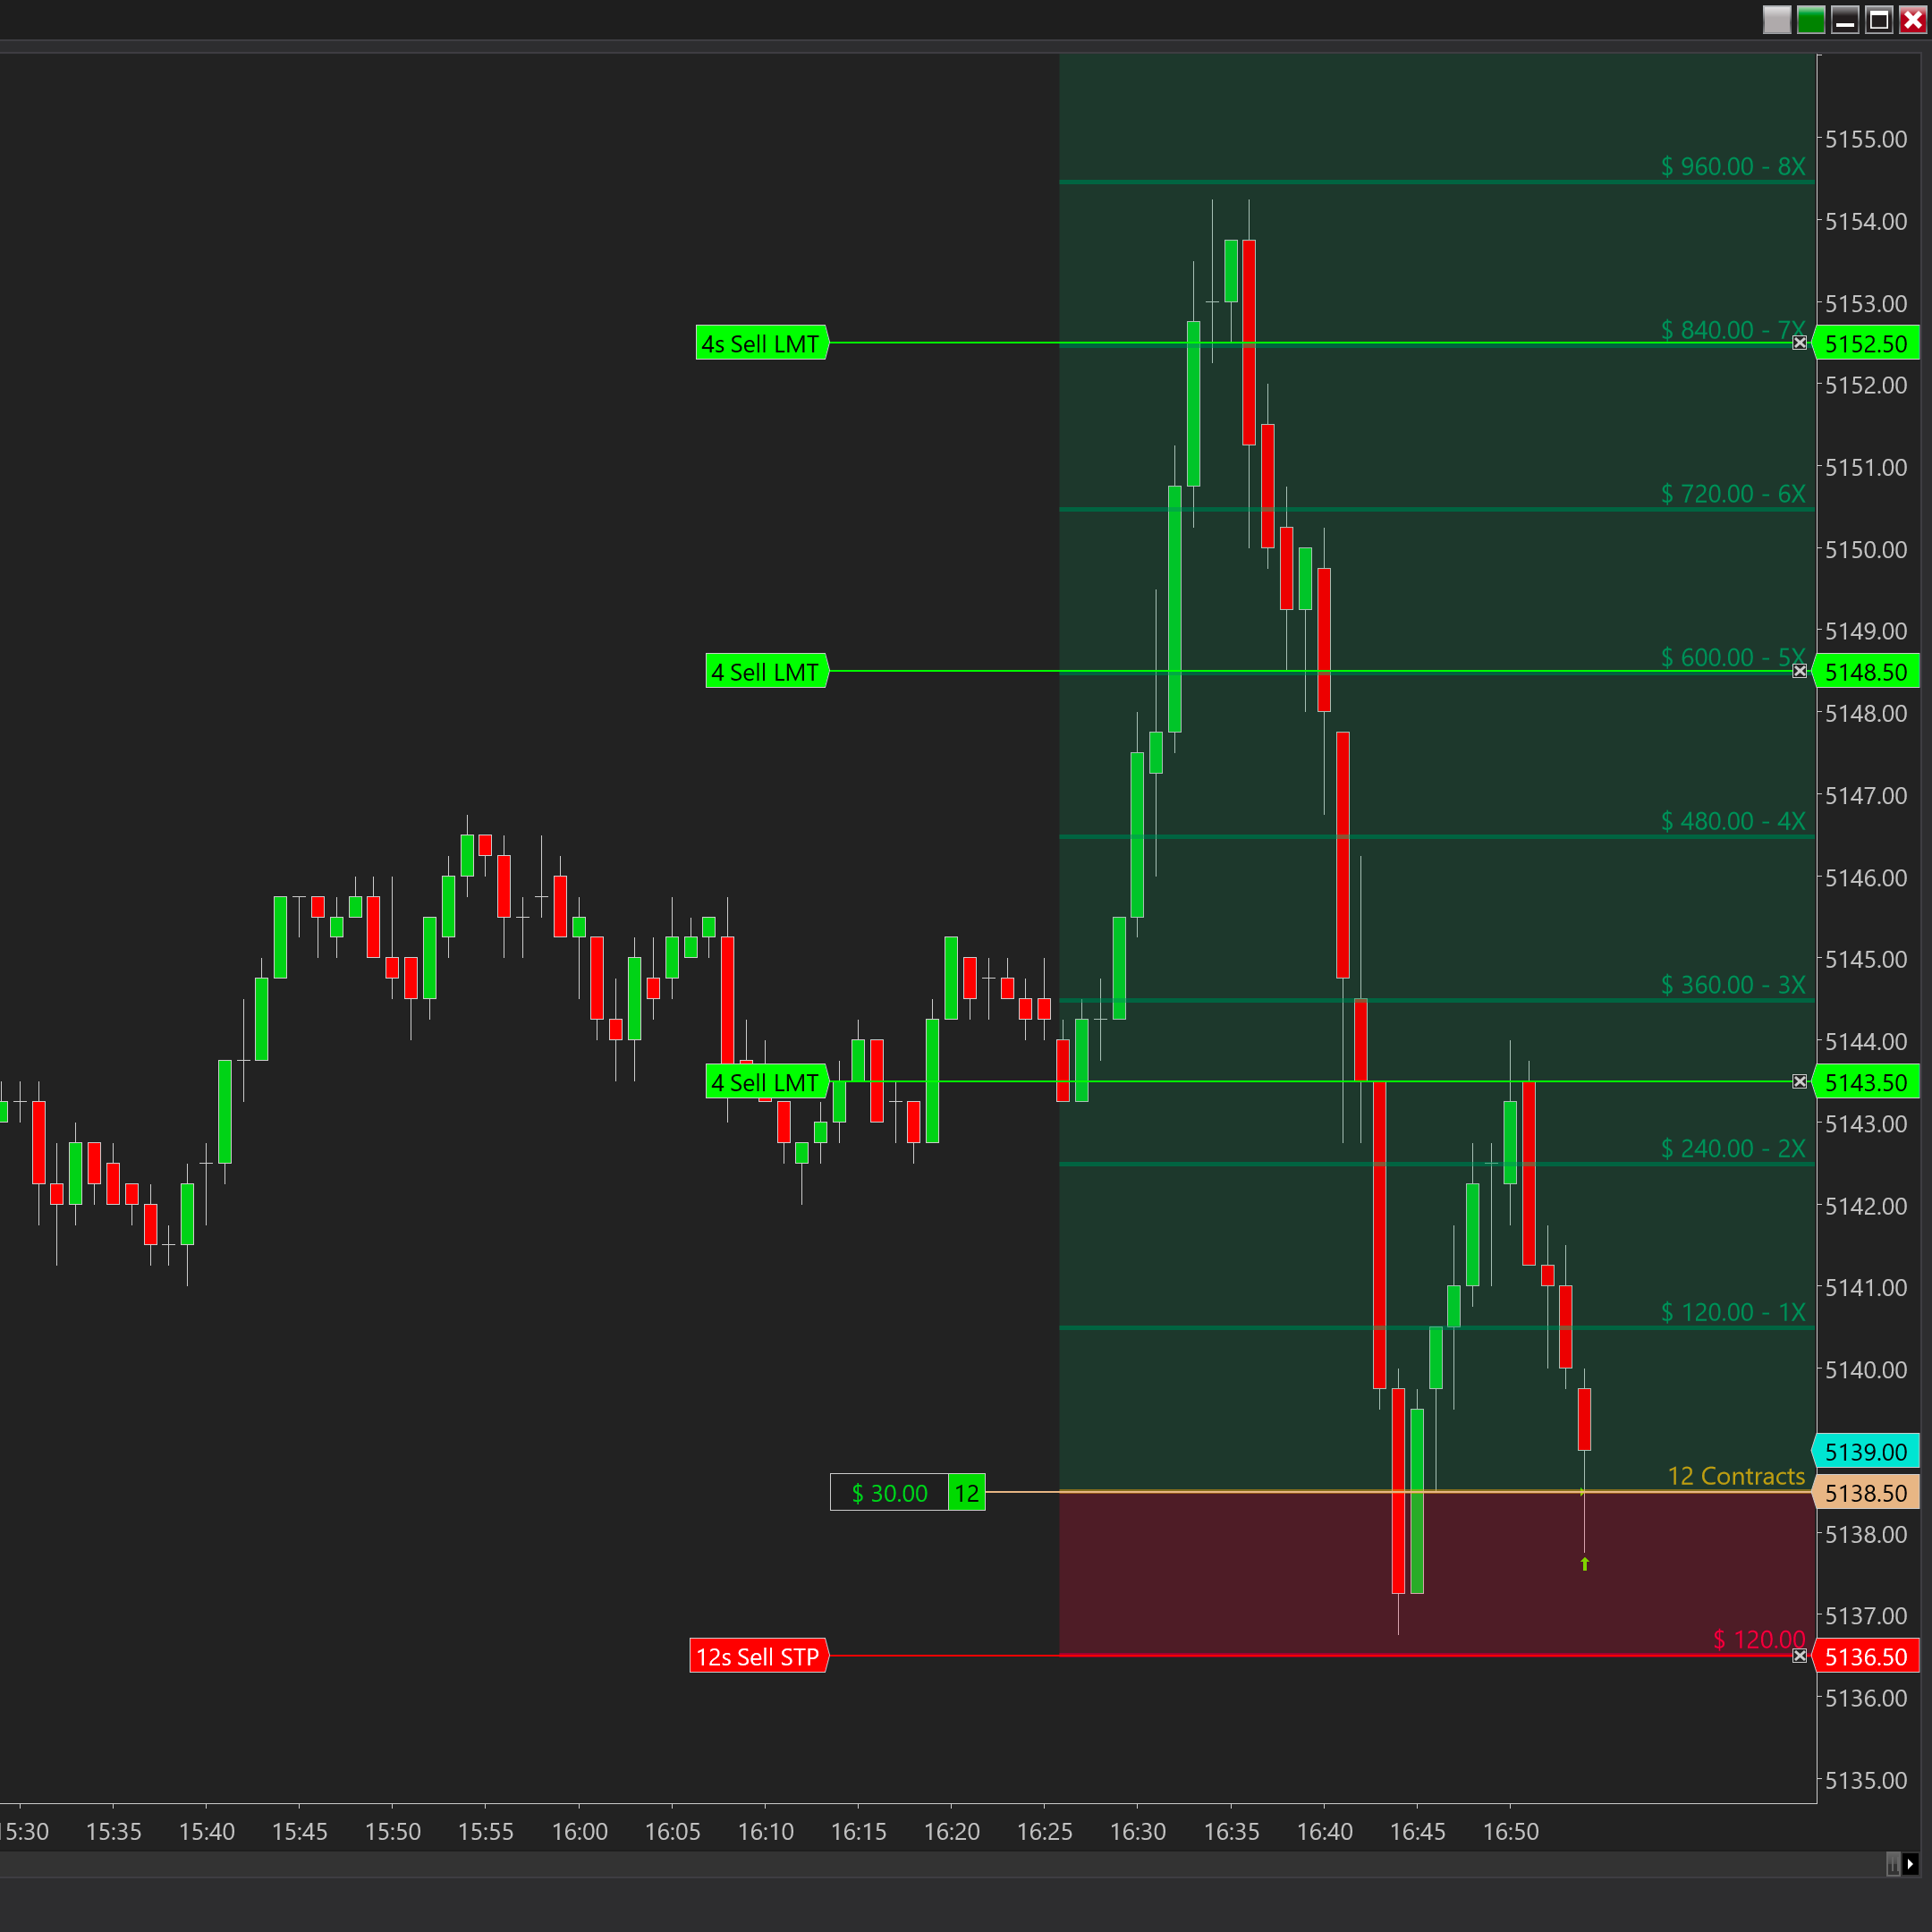
NTRR Risk Reward is a must have add-on that offers full customization, automatically calculates contracts needed based on currency risk amount, auto updates your ChartTrader quantity and your "ATM Strategy" in an instant and allowing you to use one-click entry trading based on the drawn direction.
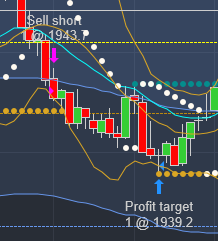
Easy Trader is a complete trading system and offers many options. The display is easy to read and use. When a signal fires, an arrow is plotted and can be used with our ATM Entry Assistant. Easy Trader is our oldest product, has been in use over the past twenty years, and it still works.
December 2, 2024
Mastering Sideways Markets With Auction Bars and Range Projections
November 19, 2024
Enhancing Your Automated Trading System: Key Insights from Best Pro Trade
November 14, 2024
NinjaTrader New Ecosystem Tools: October 2024 Edition
Enter Email for Updates