The experts say, "The Trend is your friend." DiNapoli Levels teaches you how to define ''Trend'.' The experts say, "Buy strength and sell weakness." This book teaches you how to buy weakness in an uptrend and sell strength in a downtrend, and of course, where exactly to take your profits.
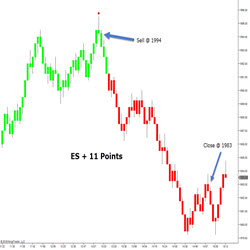
The ATS TrendReversal indicator predicts the end of a trend and reverse direction. The ATS Reversal combines multiple studies that measures distance, support, resistance and strength to pinpoint turning points in the market.
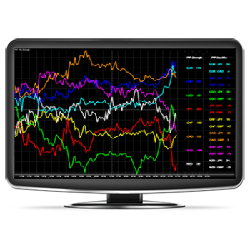
Gain an edge over the competition with FX indicators that calculate the Stochastics, RSI, DMI, ADX, ATR, and Verticality of each currency! The Fibozachi Forex Force indicators tell you exactly which currencies are the strongest and weakest, and which pairs have the most favorable correlations!
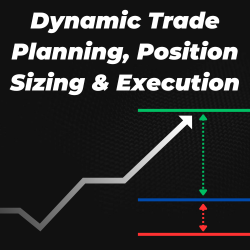
Plan & manage your trade with draggable entry, take profit, & stop loss levels. Auto-calculate & execute position size based on risk management parameters (fixed dollar, % balance, fixed contracts). Includes fixed risk reward, move to breakeven & max contracts features–the all-in-one trading tool.
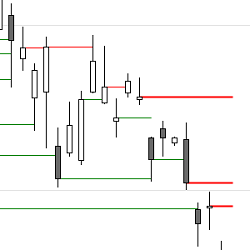
On instruments with regular trading hours you often see gaps on a chart which stay open for more than a day. A couple of times a month these open gaps from prior days also play an obvious role as support or resistance on the intraday chart. These tools are free to download and use!
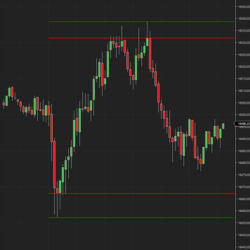
Elevate your trading strategy with the DR/iDR Indicator for NinjaTrader: Your essential tool for identifying key price levels. This advanced indicator displays both the Daily Range and the Implied Daily Range directly on your trading charts, providing crucial insights.
The indicator is compatible with any oscillator, utilizing NinjaScript signals for Market Analyzer, facilitating efficient scanning of numerous instruments simultaneously. The advanced "Lookback" feature enhances precision by allowing customization for swing points and divergence patterns.
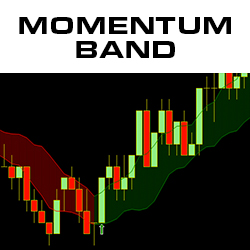
The Momentum Band indicator shows the trend and takes the noise out of the market, keeping you in trades longer, as you won’t get shaken out by temporary price fluctuations. Color changes and arrows indicate significant changes in momentum. Stay in Trades Longer & Download the Momentum Band Today!
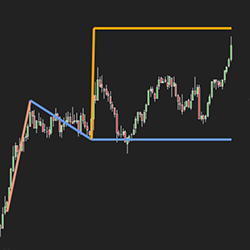
Measured moves are one of the most common trading strategies. However, they can be easy to miss. The Automated Measured Move Indicator from Tyche Trading takes away that difficulty, allowing you to focus on your trading. Never miss a measured move again. Get your seven-day free trial today!
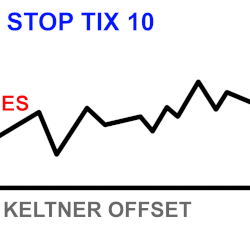
Stop Keltner uses Keltner Band distance to help give an estimated stop-loss in ticks, which is displayed in an easy-to-read text box on the chart. It’s also an excellent backtesting tool for getting estimated stops when identifying past trade entries on historical bars. Built for ES momentum traders
December 2, 2024
Mastering Sideways Markets With Auction Bars and Range Projections
November 19, 2024
Enhancing Your Automated Trading System: Key Insights from Best Pro Trade
November 14, 2024
NinjaTrader New Ecosystem Tools: October 2024 Edition
Enter Email for Updates