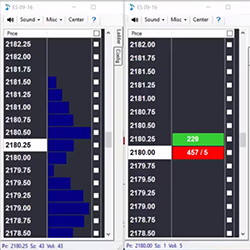
PriceSquawk empowers traders with an audible market perspective of order flow and price action across asset classes, giving traders the focus needed to respond to leading market information. Monitor markets via the customizable squawk feed, T&S trade sounds and order flow alerts.
PortfolioPilot is your personal AI financial advisor, powered by Global Predictions' award-winning Economic Insights Engine. It offers a free portfolio tracker and financial advice tailored to your needs. With this tool, sophisticated financial strategies become accessible to every investor.
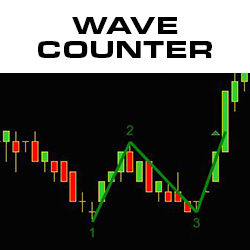
The Wave Counter indicator counts and paints waves in real time, revealing market trends, potential price reversals and no trade zones. The indicator emphasizes wave 3 as the main, informative wave, and creates a "chop box" when there are dueling waves. Download the Wave Counter today.
The LogikTickX utilizes signal processing and price reconstruction techniques to cut through the noise, reconstructing the true transaction, minimizing the hiding of large orders. This allows traders to identify and react to the market sentiment, and correlation between price and volume development.
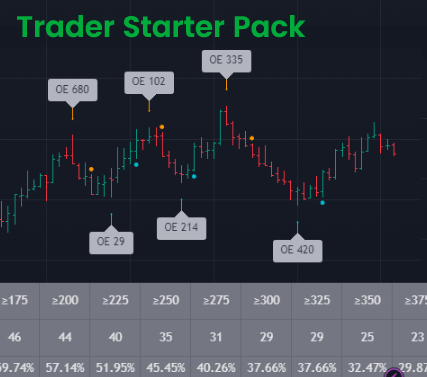
Welcome to the Trader Starter Pack: This free 5-day video course that’s taken over 38 years of combined trading experience, along with everything they’ve learnt from coaching over 20,000 clients, and packed it all into this easy to follow 5-day video course.
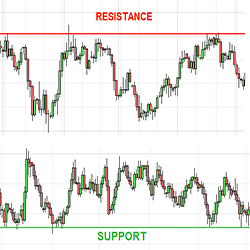
Plots chart and/or synthetic support and resistance lines from a higher time frame.
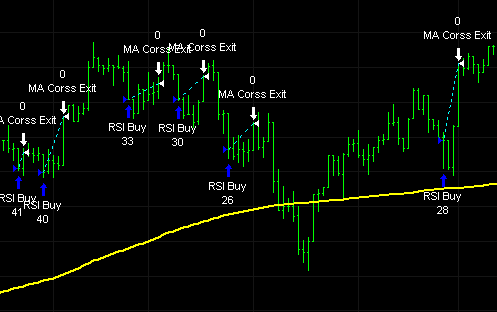
The Connors RSI2 strategy is a popular and well-known trading strategy developed by Larry Connors. It is designed to identify short-term overbought or oversold conditions in a market and exploit potential mean-reversion opportunities.
Trend lines, swing pivots, and price patterns are simple price action trading tools that seasoned traders use daily. Day Trading With Price Action, by Galen Woods, is a high-quality trading course that teaches how to effectively trade via price action analysis. Download a free chapter today!
By subscribing to our Indicator Spotlight traders get a free monthly download from the LizardIndicators indicator library. All indicator features are documented with an explanation on how the indicator can be used in a trading strategy. Sign up today!
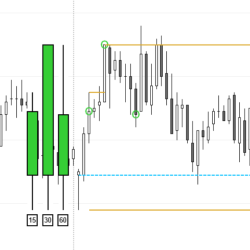
Price Action from higher time frames (5, 15, 30, or 60 min.) can point to a possible change of sentiment during the opening range. Higher time frame closing prices can be plotted on the trading chart to spot aggressive trading at these important prices. Get started with a 20-day free trial today!
December 2, 2024
Mastering Sideways Markets With Auction Bars and Range Projections
November 19, 2024
Enhancing Your Automated Trading System: Key Insights from Best Pro Trade
November 14, 2024
NinjaTrader New Ecosystem Tools: October 2024 Edition
Enter Email for Updates