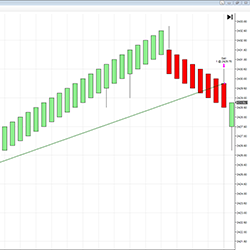
The VWAP Predator uses VWAP as a zonal guide with Bull and Bear Bands. It then uses logic to recognize accumulation and distribution candles. If those candles cross from a zone to another, then a Signal Candle is produced. Buy Signals in the Bullish Bands and Sell Signals only in the Bearish Bands.
This system will take you through the process of how to "risk 1 to make 2" that professional traders utilize to increase their profitability and have consistent months, quarters and years. The system incorporates philosophies found in "Trading in the Zone" by Mark Douglas.
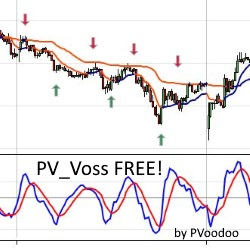
Try this FREE Voss Predictive Filter by John Ehlers & Henning U. Voss, with source code included by PVoodoo.com. Test it today for free!
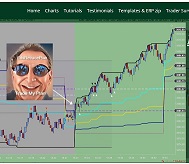
The ribbon-like indicator, Fantastic MA Ribbon, is created by plotting multiple moving averages (MA) with varying lengths. It incorporates four signal mechanisms, offering diverse options to align with your unique trading style.
Free Discord EdsRetracePlan with Markers Plus CHAT. Using a single indicator and Range charts, you can automate CL, NQ and GC trade entries by turning on Markers Plus. Trades will be taken using the ERP long or short signals. Talk in the free Discord chat about how easy it is to trade with ERP & MP.
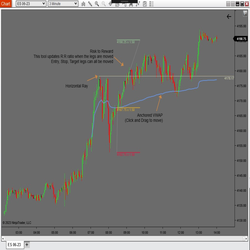
PureAlgo has developed a set of drawing tools to assist you with trading, including Anchored VWAP, Risk Reward PA and Horizontal Line. The package includes all of the tools and is priced at $10.
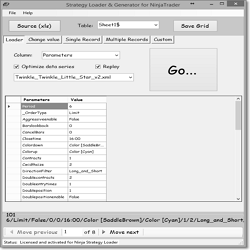
The Ninja Strategy Generator allows traders to make changes to the Parameters record that exports from NinjaTrader to create new strategies with slight variations of the strategy you wish to optimize.
The BuySide Global Auto Trader is a state of the art automated trading system monitoring software recognition of Institutional Buy and Sell programs. The system is universal and will work in any liquid market and many timeframes. Learn more!
Master quantitative trading with our courses. From back-testing basics to advanced strategy development, learn to build systematic trading systems. Explore futures, pairs trading, & essential Python programming tailored for financial markets. Gain a trading edge with real-world examples. Enroll now!
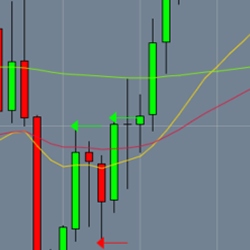
One minute chart entry indicator after a trend reversal on the 5-minute chart. The indicator looks for the first entry after hitting the 20EMA, and a W bottom or M top depending on the direction afterward. All that is needed is a 20EMA on the 5-minute, and a 20EMA and 200EMA on the one minute.
December 2, 2024
Mastering Sideways Markets With Auction Bars and Range Projections
November 19, 2024
Enhancing Your Automated Trading System: Key Insights from Best Pro Trade
November 14, 2024
NinjaTrader New Ecosystem Tools: October 2024 Edition
Enter Email for Updates