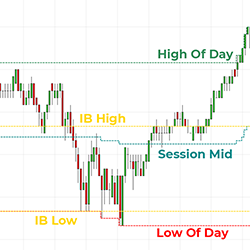
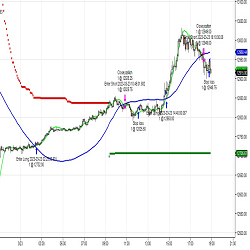
Initial balance, session mid & day mid are common market profiling levels used in day trading futures, stocks & ETF’s. This indicator automatically plots and updates these levels on any intraday chart, providing clear targets for trade entries & exits. Get started now and enhance your charts!
The SuperDOM Average Price Column shows a position average price accumulated since the first order execution. All opened and closed executions from the beginning of the position are used for the calculation. Save time by knowing your current position's average price for all of your past entries!
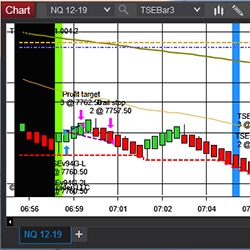
Traders Strategic Edge ™, or TSE, is a fully automated trading system that trades automatically once configured by the user. For details visit Rhino Software’s website and see the product in action. Take advantage of the 30-day paid trial and check it out for yourself.
A traditional Gann Fan with upgraded features. Save time with the Speedkey onscreen task command buttons. Derive better leading edge, price action information from your Gann Analysis, including support and resistance identification and real-time price momentum information. Contact for a free trial.
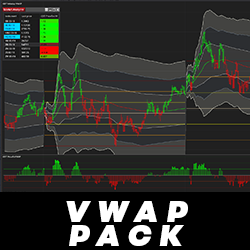
The VWAP Pack includes a VWAP Indicator with current and previous levels, a Price to VWAP indicator to output the position of price, and a Market Analyzer template! With the Price to VWAP indicator, it is easy to monitor the position of price in relation to the current VWAP.
Bstrader-automatic is a powerful trend following automated trading system. It has customizable parameters, different position sizing methods, fixed size, equity percentage, atr, price percentage, ATR Trailing Stop, Market Money Scale In and Scale Out, Volatility Compass, Daily loss limit and more.
Trading Mentor is an automatic system based on data science which helps traders understand the most important insights of their trading and adjust their trading strategies for consistent results.
According to your technical plan, Advanced Software Features will implement a trading idea or an indicator idea using the C# computer code and the NinjaTrader 8 terminal. With the help of additional mathematical libraries, they will be able to develop complex trading algorithms with you.
You can draw the risk/reward roulette tool at any point on a candlestick chart simply by clicking on the chart with the middle mouse button. This indicator allows you to speed up the drawing of the risk/reward tool on the chart by times, expanding on the functions of the trading platform.
The FiReZ Trading Strategy is an original and modern refinement of Fibonacci technical analysis. This Fibonacci trading strategy may be the last strategy that you'll need to learn. Stop making trading complicated and learn how to analyze and trade in a simplified, structured, and repeatable system.
December 2, 2024
Mastering Sideways Markets With Auction Bars and Range Projections
November 19, 2024
Enhancing Your Automated Trading System: Key Insights from Best Pro Trade
November 14, 2024
NinjaTrader New Ecosystem Tools: October 2024 Edition
Enter Email for Updates