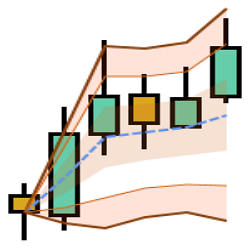
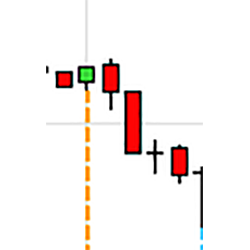
It is not always easy to quickly determine the size of a bar by looking at the price axis. BarSizeCounter allows you to instantly observe the size of the bar and how far the current price is from its high and its low.
DrawCator VWAP is a feature-rich drawing tool which plots VWAP (+SD Bands) by mouse drag-n-draw on custom start & end points. New Attach and Roll modes provide auto updating and forwarding with live markets. Alerts, Ninjascripting, Strategy & Market Analyzer and 1-Click draw are all supported.
ElliottWaveTrader offers a live Trading Room of market analysis, based on Elliott Wave principle. Founded in 2011, the site benefits traders looking to anticipate the direction of U.S. & world equity indices, stocks, bonds, metals, energy & more over a time horizon of several days to several months.
Live trading room for ES S&P 500 day traders. Based on Rose’s Fibonacci trading system, charts are posted and price action shared. Previous trades are reviewed so that students can improve. Discord chat room goals: help students become independent traders & provide a supportive community.
We provide traders with an opportunity to earn live funding based on their trading performance in simulated accounts.
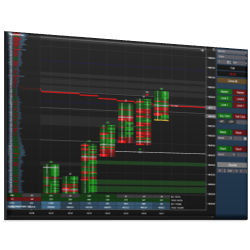
This strategy uses a collection of moving average and oscillator indicators to identify trends in the market. The use of limit orders for entry and exit orders get's you the best price possible when buying or selling. This strategy uses both long trades and short trades.
Several studies have found a connection between full and new moons and stock market performance. Knowing how and when to time the cycles in trend shifts is centuries old, but new to most traders.
This indicator plots signals, targets, and stops based on support and resistance from various moving average types. The trend is established based on a minimum number of bars above or below the moving average. The signal is initiated on the first touch of the moving average.
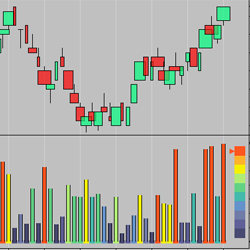
The IT_VolZoom, shown with IT_FatBars (uses same engine), shows volume level relative to the surrounding volume. The histogram is colored according to a 10 step heat meter which is shown on the right (bar colors optional). It accurately shows high volume even in low volume conditions.
Creating custom algorithmic trading solutions that provide out of the box edge.
December 2, 2024
Mastering Sideways Markets With Auction Bars and Range Projections
November 19, 2024
Enhancing Your Automated Trading System: Key Insights from Best Pro Trade
November 14, 2024
NinjaTrader New Ecosystem Tools: October 2024 Edition
Enter Email for Updates