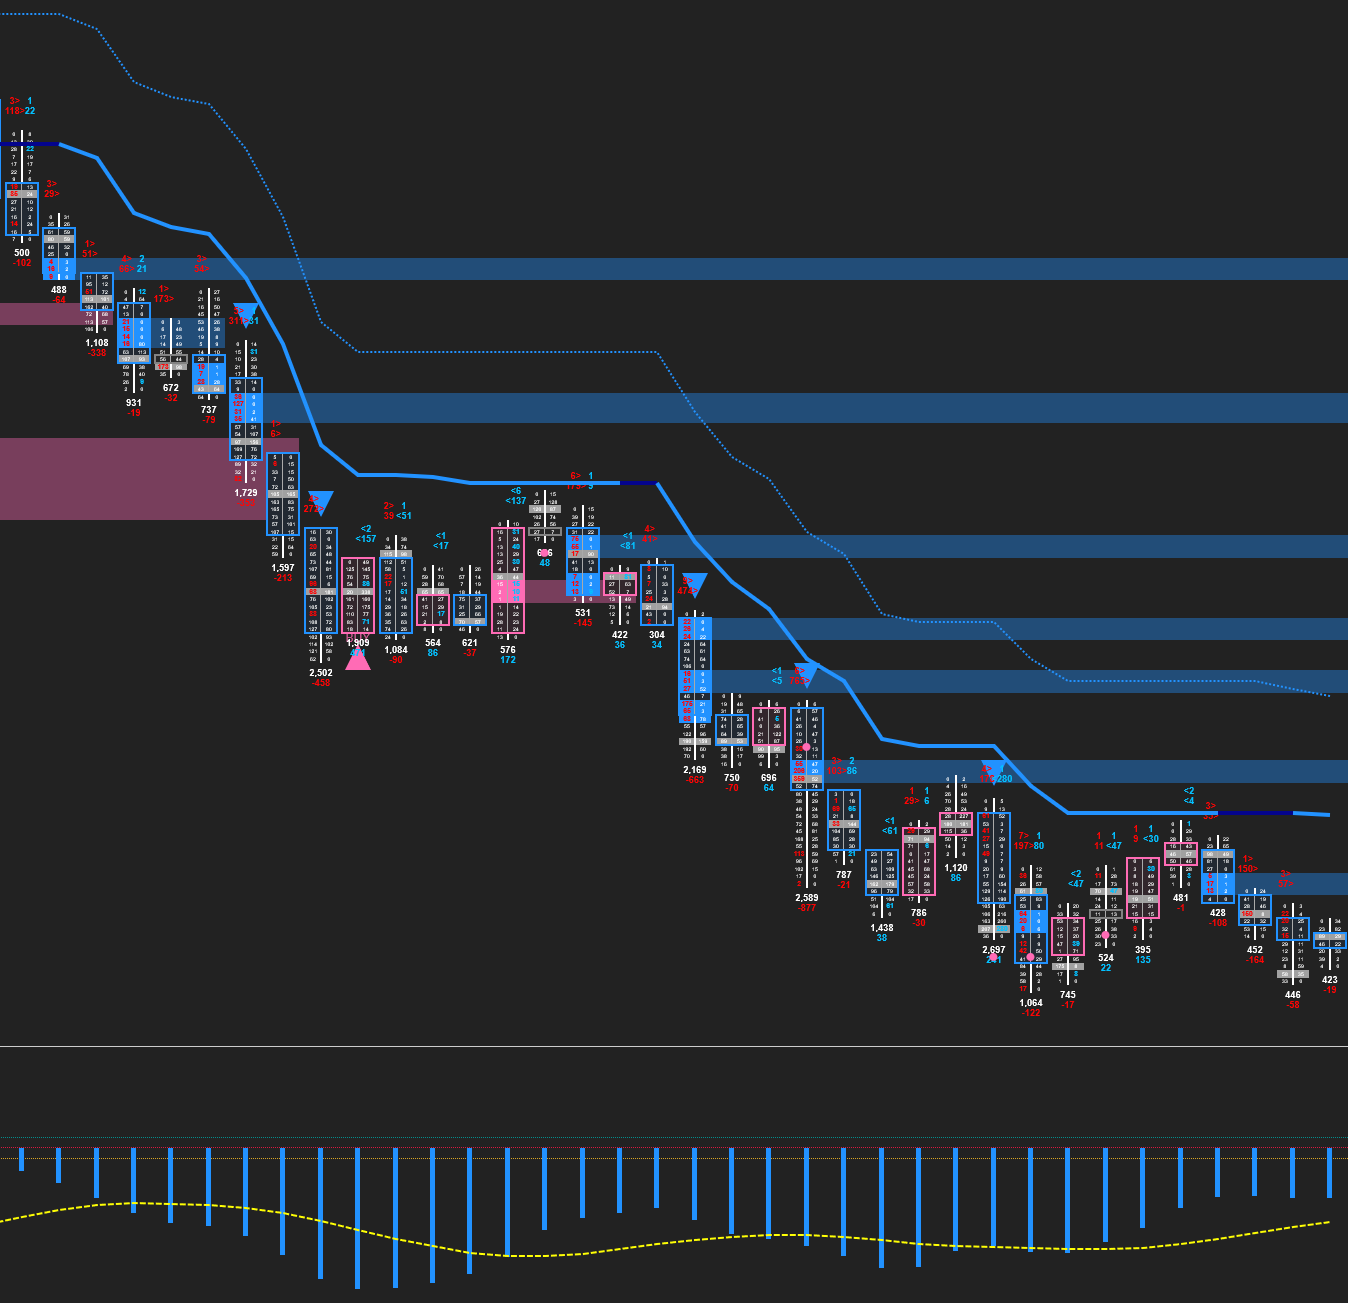
China Market Data, Order Flow
Track the open and close sessions of up to four different market times on your chart. A marker plots offset above and below the bar that corresponds to your time setting, which are all parameters that the user custom configures in the indicator properties window.
Get all of the most critical indicators in one package. Market Levels provides VWAP, Value Area High/Low, Point of Control, Initial Balance, Open, High, Low, Close and more helping you identify key price areas. Levels are plotted for the full session and a user customized session.
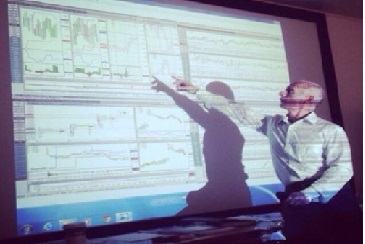
This masterclass delivers on all fronts, providing all the fundamental knowledge and practical trading skills required to trade any asset class and in any market conditions. This course is designed specifical for those committed to making trading their career. Diploma plus gain your trading skills.
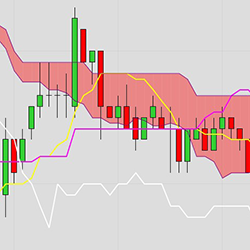
Free Ichimoku Cloud Indicator for NinjaTrader 8! This indicator can be used for both discretionary trading or as part of a NinjaScript based strategy. Download it today!
The Buy/Sell Zones are an adaptive approach to expansion and contraction within market rotations. Each rotation provides an area of interest for either the bid or offer, where they need to engage in order to protect the possibility of further extension. This approach allows you to trade with trend.
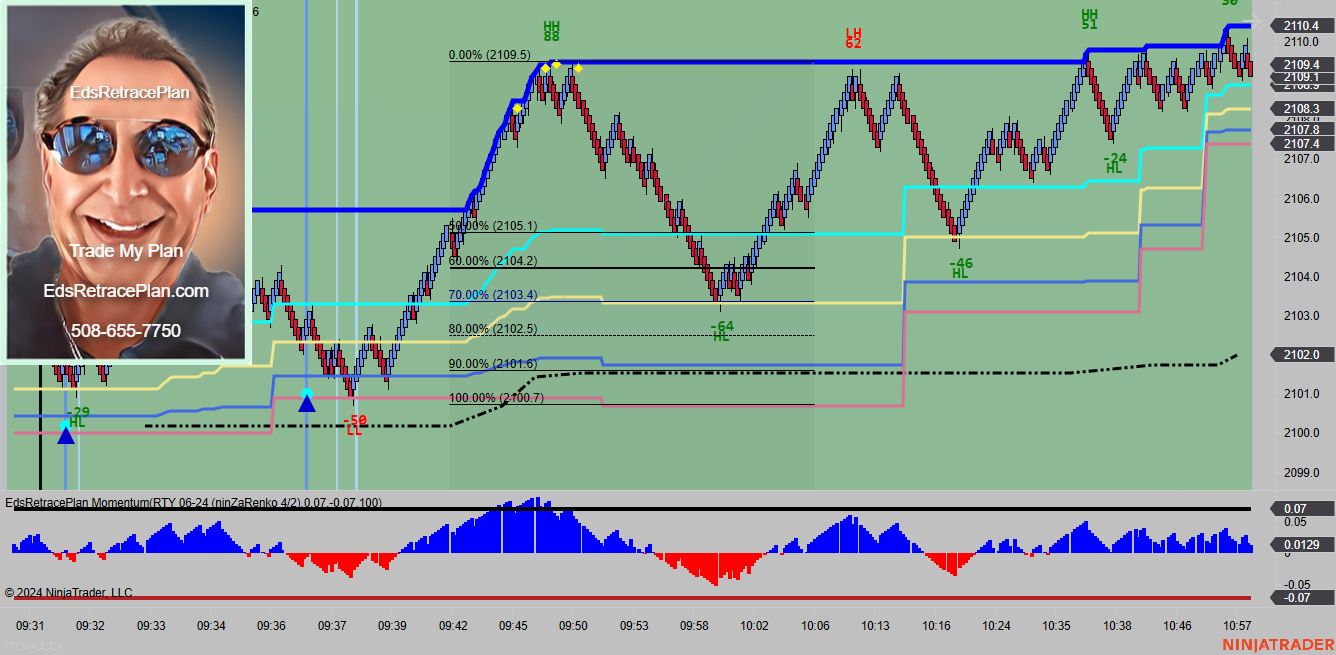
EdsRetracePlan Momentum Reversal Indicator is for day trading ES, YM, RTY, NQ, CL and GC. The indicator identifies reversal trades by finding and marking tops and bottoms. These trades signal the end of a move and opportunities to get short at the highs and long at the lows.
Easily build order flow strategies using bar point of control and value areas highs and lows. No complex coding required. Optimal Value Area is fully compatible with Strategy Builder.
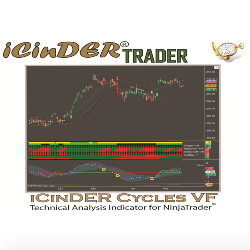
The iCinDER™ Cycles VF (Velocity Force) indicators allow for a quick validation of analysis, thus speeding up reaction time to market movement's bias. The analysis is based on velocity force of the instrument being analyzed.
OTM Volume Profile is essential to understand the auction behavior and find key price reaction zones, such as the VPO, high and low value area. This profile preserves and allows to visualize these levels historically, which distinguishes it from static profiles.
December 2, 2024
Mastering Sideways Markets With Auction Bars and Range Projections
November 19, 2024
Enhancing Your Automated Trading System: Key Insights from Best Pro Trade
November 14, 2024
NinjaTrader New Ecosystem Tools: October 2024 Edition
Enter Email for Updates