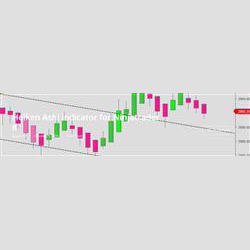
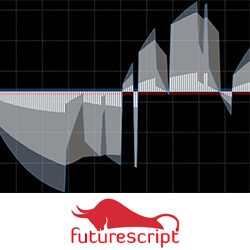
Much more than just a great looking set of Heiken Ashi bars! Integrated supply and demand levels, voice alerts, picture-in-picture mode, bar speed monitoring as well as volume and trend analysis. Super clean and fast with lots of options. API for the zones and algo bias. Free trial available.
Cutting-edge NinjaTrader 8 Risk Reward Indicator empowers you to make informed decisions with unparalleled precision. Effortless extension, tailored risk levels, adjustable aesthetics, with free 14 days trial and 24/7 support line.
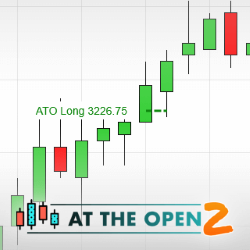
Use the ATO 2 indicator and learn how to take advantage of big price action moves right after the market opens. This is our flagship day trading method which we have improved over the years. Come see what put us on the map. Package includes both video and live training.
Several studies have found a connection between full and new moons and stock market performance. Knowing how and when to time the cycles in trend shifts is centuries old, but new to most traders.
The ROC/Wave Velocity is a bundled package with a momentum indicator including 10 types of averages with 3 oscillator inputs driven by 3 price options. It provides an added layer of discovery into the price action by measuring the acceleration/deceleration of price and the relative trajectory.
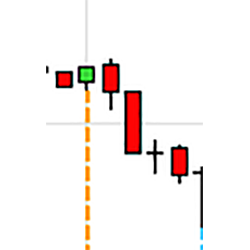
The Exhaustion Absorption Detector, which is based on live time and sales data, is designed to display order activity between the bid and offers at market price.
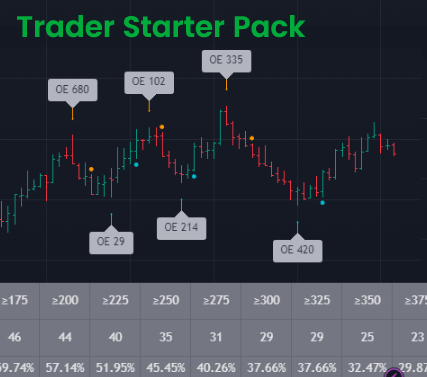
Welcome to the Trader Starter Pack: This free 5-day video course that’s taken over 38 years of combined trading experience, along with everything they’ve learnt from coaching over 20,000 clients, and packed it all into this easy to follow 5-day video course.
PureMO & ScalpMO: The ultimate combo for momentum and scalping mastery. Track momentum, dominate scalping. Two cutting-edge tools in one package, built to transform your trading. Try it free for 7 days and see the difference!
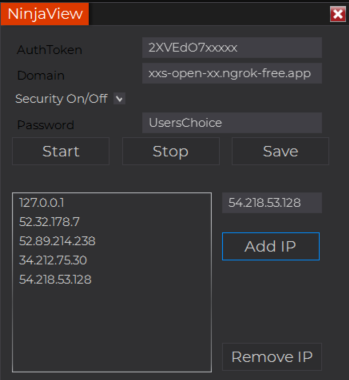
TradingView to NinjaTrader webhook. Automate your TradingView scripts directly into NinjaTrader. Webhook can use ngrok for free public facing domain or be used as a standalone locally for quicker execution. Extra features include custom password protection and IP whitelist for added security.
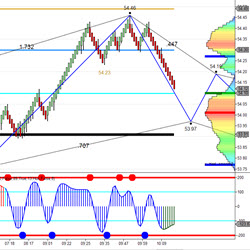
Polaris Trading Group provides futures day trading education that includes an Online Study Course & Live Trading Room. Trading veteran and Commodity Trading Advisor (CTA), David D Dube, provides traders specific support & resistance levels & trade setups based on Market Profile and volume analysis.
December 2, 2024
Mastering Sideways Markets With Auction Bars and Range Projections
November 19, 2024
Enhancing Your Automated Trading System: Key Insights from Best Pro Trade
November 14, 2024
NinjaTrader New Ecosystem Tools: October 2024 Edition
Enter Email for Updates