The indicator monitors the accumulation of bar-by-bar volume delta throughout the day. It decides market trends based on the analyses of cumulative delta + moving median of cumulative delta + price action. We can proudly say that this version is a one-of-a-kind delta interpreter.
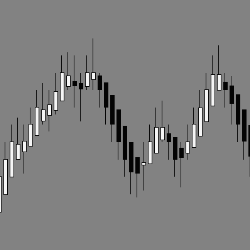
EPyFBarsType is a tick-based bar, unlike time-based bars such as regular Japanese candles. These bars are one of the main components of our system, due to the objectivity they provide for technical analysis. This bar type helps in identifying market moves and avoiding choppy areas.
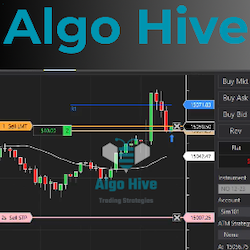
BurstAlgo is a straightforward and efficient automated trading tool designed to trade prop-firm accounts. It's built to preform up to three trades daily, focusing on consistent trading. This algorithm is all about keeping things practical.
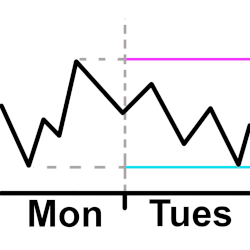
Plot a horizontal line for the high and low from the previous intraday. The user configures the open and close time they want to use for the intraday hours. This means the user can plot the high and low starting 30 minutes before the actual open and after the actual close if they want to.
The Quantum Dynamic Volatility indicator paints volatility as price action unfolds - no more guesswork, no more nasty shocks. Watch and wait, then trade with this safety-first indicator!
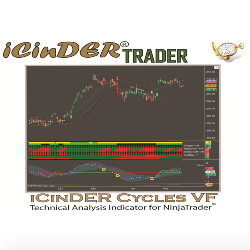
The iCinDER™ Cycles VF (Velocity Force) indicators allow for a quick validation of analysis, thus speeding up reaction time to market movement's bias. The analysis is based on velocity force of the instrument being analyzed.
Build a foundation for technical and fundamental analysis. Prioritize tools, learn proprietary calculation and information management through strategies universal in application. Includes Daily Briefing, Evening Chartbook & Market Recap, plus Sunday Evening Review. ES, Oil, Gold 10 yr. Note, NQ.
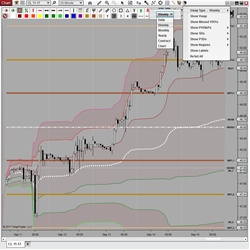
VWAP Plus features 7 configurable Session Types (Daily, Weekly, Monthly, Contract, etc.) and 3 user defined upper and lower standard deviations. It displays 17 Unique Current & Previous Levels, includes a toolbar icon for easy setup, and is Market Analyzer, Strategy Builder & Bloodhound ready!
Quickly save and load sets of parameters in NinjaTrader. If you are tired of changing indicator and strategy parameters multiple times, SaveAndLoad adds a new system-wide feature for saving and loading any number of parameter sets, for indicators, for strategies, and for the Strategy Analyzer!
An in-depth course specifically developed to trade Nasdaq futures using Bookmap.com and take advantage of its unique behavior, the NQ Order Flow course includes 3 hours of deep dive into all order flow patterns and how to exactly trade them, exhaustions, absorptions, spoofs, book flips and more.
December 2, 2024
Mastering Sideways Markets With Auction Bars and Range Projections
November 19, 2024
Enhancing Your Automated Trading System: Key Insights from Best Pro Trade
November 14, 2024
NinjaTrader New Ecosystem Tools: October 2024 Edition
Enter Email for Updates