You can draw the risk/reward roulette tool at any point on a candlestick chart simply by clicking on the chart with the middle mouse button. This indicator allows you to speed up the drawing of the risk/reward tool on the chart by times, expanding on the functions of the trading platform.
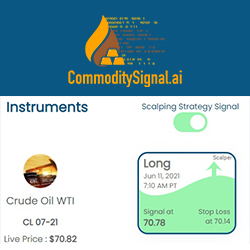
CommoditySignal.ai is an AI-powered Robo Advisor! Trade energy, metals, and agro commodities futures like crude, gold, and silver with an AI algorithm's expertise. Additional features like newsroom and chatroom keep you updated on the latest trends. Free forever - no need for a credit card!
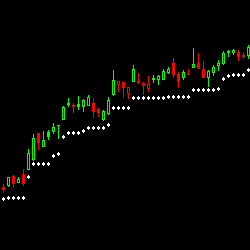
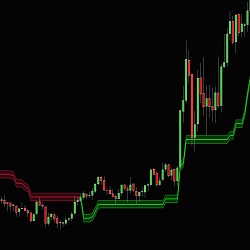
Based on ATR our Trailing Stop indicator has been designed to take all the hassle out of calculating and re-calculating your ‘stop losses.' It does this for you automatically. It also alerts if your stop is hit. A must for day and swing traders.
Advanced Trading Signals offers support to traders wishing to transform their trading concepts into workable indicators and fully automated strategies. They use best practices and leverage decades of programming experience to build and deploy solutions for traders of all types.
Convert indicators, strategies and algorithms from any platform to NinjaTrader 7 or NinjaTrader 8! Contact Patternsmart for a quote today!
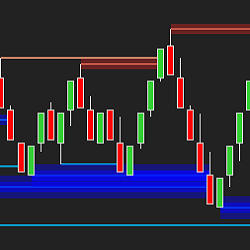
Introducing Friend Zone, a professional market indicator designed to identify mean reversion opportunities with precision. By analyzing price movements and historical data, Friend Zone intelligently detects when a security has deviated significantly from its average value.
Forex Trading Unlocked Online Trading Courses provide forex, futures, options, and binary options traders with the tools they need to navigate stormy market environments. Learn for yourself how to recognize trading setups that put you in the driver's seat of your trading destiny.
The MCumulativeDelta Indicator shows the bid / ask volume displayed in a histogram over a period. It serves to determine whether supply or demand is dominating and in control and the buying / selling pressure.
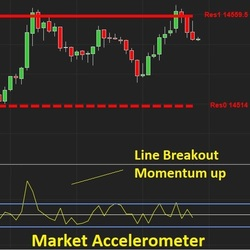
The E.G. AI Accelerometer reveals the driving force behind the price movements of an asset; by measuring how many buyers and sellers are in a market, it helps you form a view of the future direction of the price and – crucially – how fast that movement may be.
Easily track swing highs and swing lows in multiple timeframes across your chart. Simply define your three swing strengths and Optimal Levels uses heatmap graphics to plot those key levels until they are touched. Strategy Builder compatible!
December 2, 2024
Mastering Sideways Markets With Auction Bars and Range Projections
November 19, 2024
Enhancing Your Automated Trading System: Key Insights from Best Pro Trade
November 14, 2024
NinjaTrader New Ecosystem Tools: October 2024 Edition
Enter Email for Updates