The market efficiency is an oscillator-based gauge which monitors bid and offer information in an adaptive sequence. By monitoring such action, the user will be able to determine efficient (directional) or inefficient (turning) price action.
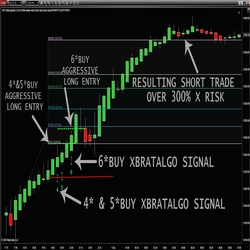
Think of an experienced trader’s brain as a blueprint for a trading algorithm. Then, add the desire to keep charts as clutter-free as possible. Nine decision points defines a 3* trade, 10 decision points makes it a 4* trade, 11 decision points for a 5* trade and 12 decision points for a 6* trade.
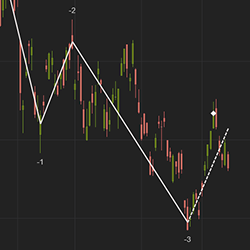
The Wave indicator is similar to an Elliot Wave with an added capability to forecast a possible market reversal. It has convenient features including the ability to number waves to help identify trend direction.
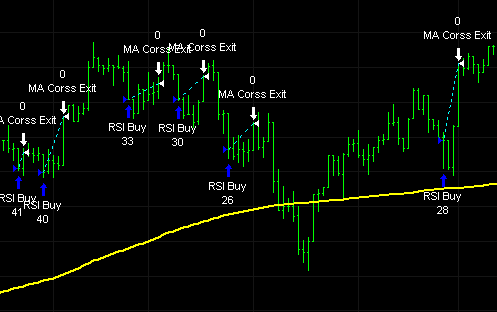
The Connors RSI2 strategy is a popular and well-known trading strategy developed by Larry Connors. It is designed to identify short-term overbought or oversold conditions in a market and exploit potential mean-reversion opportunities.
Fully automated E-mini trading systems. These auto traders are designed to operate continually and without any human intervention. All of our systems have gone through extensive testing to ensure that hypothetical backtests are as closely representative of a live trading environment as possible.
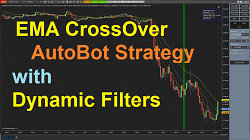
The EMA CrossOver Strategy is one of the simplest, for ease of use and understanding. This simple strategy has been enhanced with a third EMA as a filter for taking a long or a short entry. This EMA filter helps reduce unwanted entries.
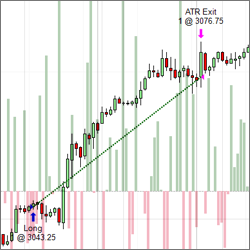
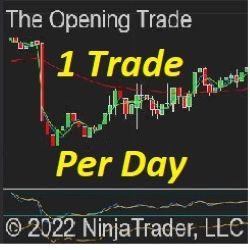
Signals are produced by an imbalance of prices between sessions, a principle of markets based in physics. You have the potential of 1 trade per day, automated from start to finish and designed to be monitored in some capacity. Users have full control of strategy parameters.
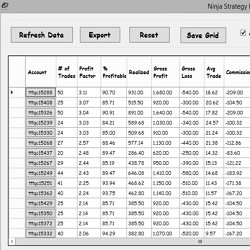
View strategy performance results calculated outside of the NinjaTrader platform. The Strategy Performance tool uses a CPU process separate from NinjaTrader to extract a detailed trade performance summary from Market Replay, Live or Simulated Trading.
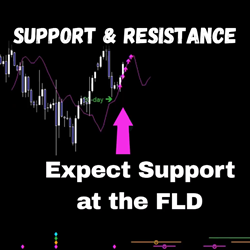
Perform an expert Hurst cycle analysis on any instrument/timeframe chart, and gain insight into hidden levels of support & resistance with accurate targets. Interactions between price & the Future Line of Demarcation (FLD) are identified for you, enabling anticipation of price action ahead of time.
Sigmalab offers quantitative analysis-based technologies and services to analyze trading logics, operative patterns and trading systems. Learn more!
December 2, 2024
Mastering Sideways Markets With Auction Bars and Range Projections
November 19, 2024
Enhancing Your Automated Trading System: Key Insights from Best Pro Trade
November 14, 2024
NinjaTrader New Ecosystem Tools: October 2024 Edition
Enter Email for Updates

.png)