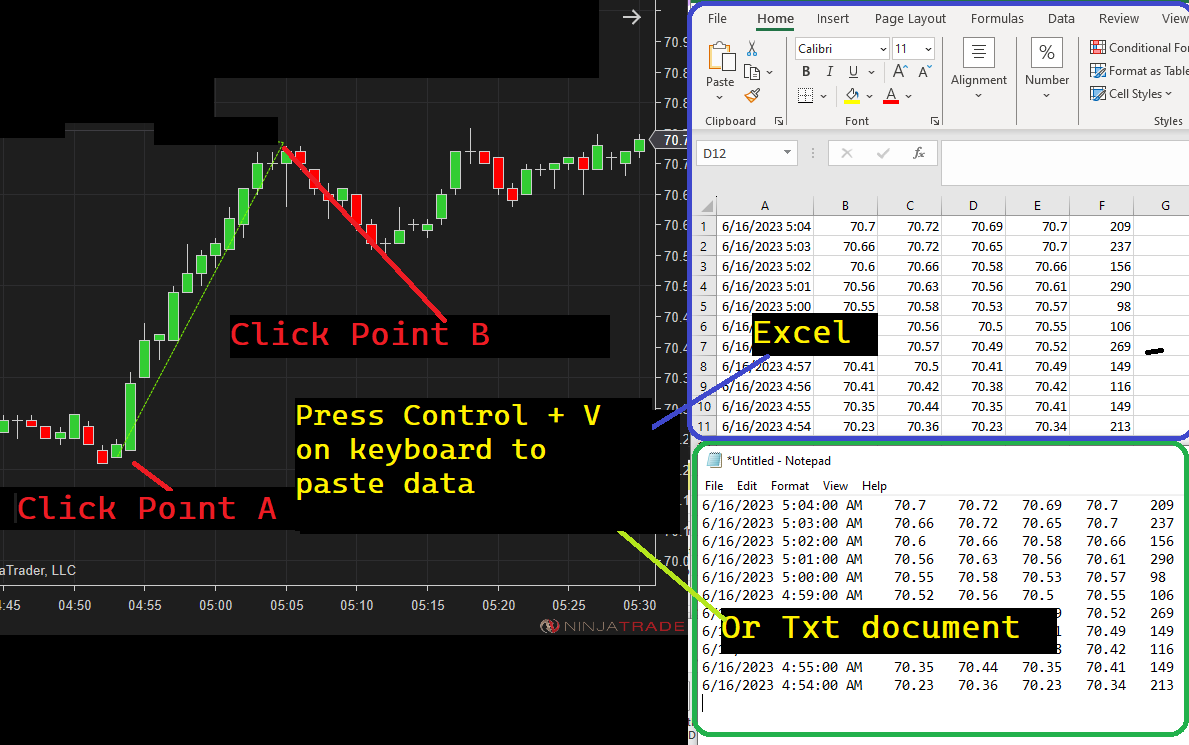
This innovative tool allows you to select any two points on your chart – effortlessly copying the corresponding bar values – and paste them directly into Excel or a text document using the familiar Ctrl+V shortcut.
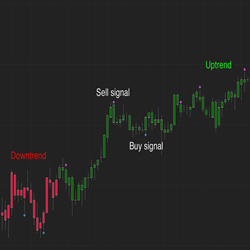
The KSqueeze Trading System allows traders to quick scalp the markets with a combination of custom price bars & indicators to target trade setups in the Futures, FX & ETF markets. Complete with audible & visual trade signals, member training, support & more! Get Started with a 1-Month Trial Today!
2 Cores (Intel Xeon E-3.70GHz), 4GB DDR4 RAM, 40GB NVMe SSD, 1x Dedicated IP address, Windows 2019, Free Installation, Unlimited Traffic, RDP/iOS/Android/Mac/Parallel access, Supports All FUTURES Platforms, CLOUD Anti-Virus & Malware Protection, Immediate Activation
TTT Range Indicator plots the data from the TTT E-book directly on NinjaTrader Charts. Determine the range of an instrument prior to potential reversals, and the average once the high and low for the day is recorded. Learn more!
They provide educational videos on trading strategies and analysis for algorithmic trading markets. They offer insightful tips and techniques to help traders make informed decisions. Subscribe now to gain valuable trading knowledge and stay ahead of the competition.
Volatility Quality Indicator (VQI) is a technical indicator that was developed to identify quality stocks with low volatility. The indicator is based on the assumption that assets with low volatility are less risky & more stable. The original concept by Thomas Stridsman was first published in 2002.
Q-ProTrader is a fully integrated day trading automated strategy which trades the E-mini futures contract. This package includes both the Q-ProTraderIndicator and Q-ProTraderStrategy.
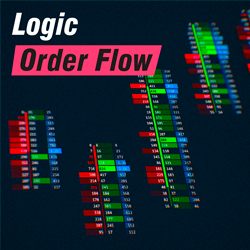
Logic order flow features unique and easy-to-use graphical options, one-click presets and configurations, a profile, footer, and databox for a complete market analysis. It guarantees the best visualization of patterns and zones, making this tool one of the best options on the market.
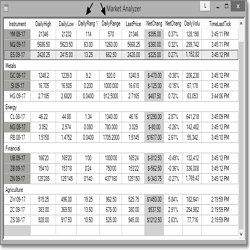
A Market Analyzer column that allows traders to view the daily range of an instrument in points or currency.
The VTP was created to provide Veterans with an introduction to financial markets. The Stage 5 Online Course educates traders on how to approach their funding challenges within the Prop Firm space. It aims to helping support traders to succeed, and build a sustainable trading business.
December 2, 2024
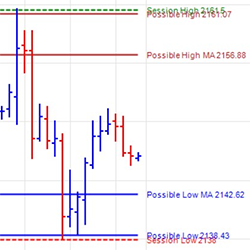
Mastering Sideways Markets With Auction Bars and Range Projections
November 19, 2024
Enhancing Your Automated Trading System: Key Insights from Best Pro Trade
November 14, 2024
NinjaTrader New Ecosystem Tools: October 2024 Edition
Enter Email for Updates