This product is a automated bot strategy that work on NQ and MNQ only.
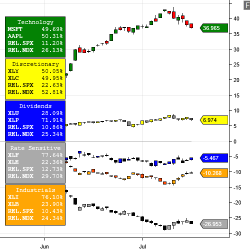
SectorJunky builds MarketCap Weighted Indexes from stock symbols with no math required. All indexes are perfectly weighted. You can also build Custom Weighted Indexes.
This is the "heads-up display" indicator that has made The Intentional Trader famous since 2009. It will tell you when the “Smart Money” market makers are likely to be manipulating price. If you know that, then you can evaluate what may happen next - a huge edge in day trading!
Convert indicators, strategies and algorithms from any platform to NinjaTrader 7 or NinjaTrader 8! Contact Patternsmart for a quote today!
Gorilla Futures offers a complete FootPrint indicator. This indicator works on all NinjaTrader 8 licenses. FootPrint Pro™ is 100% customizable and can identify and alert traders to imbalances, delta signals, volume, and more.
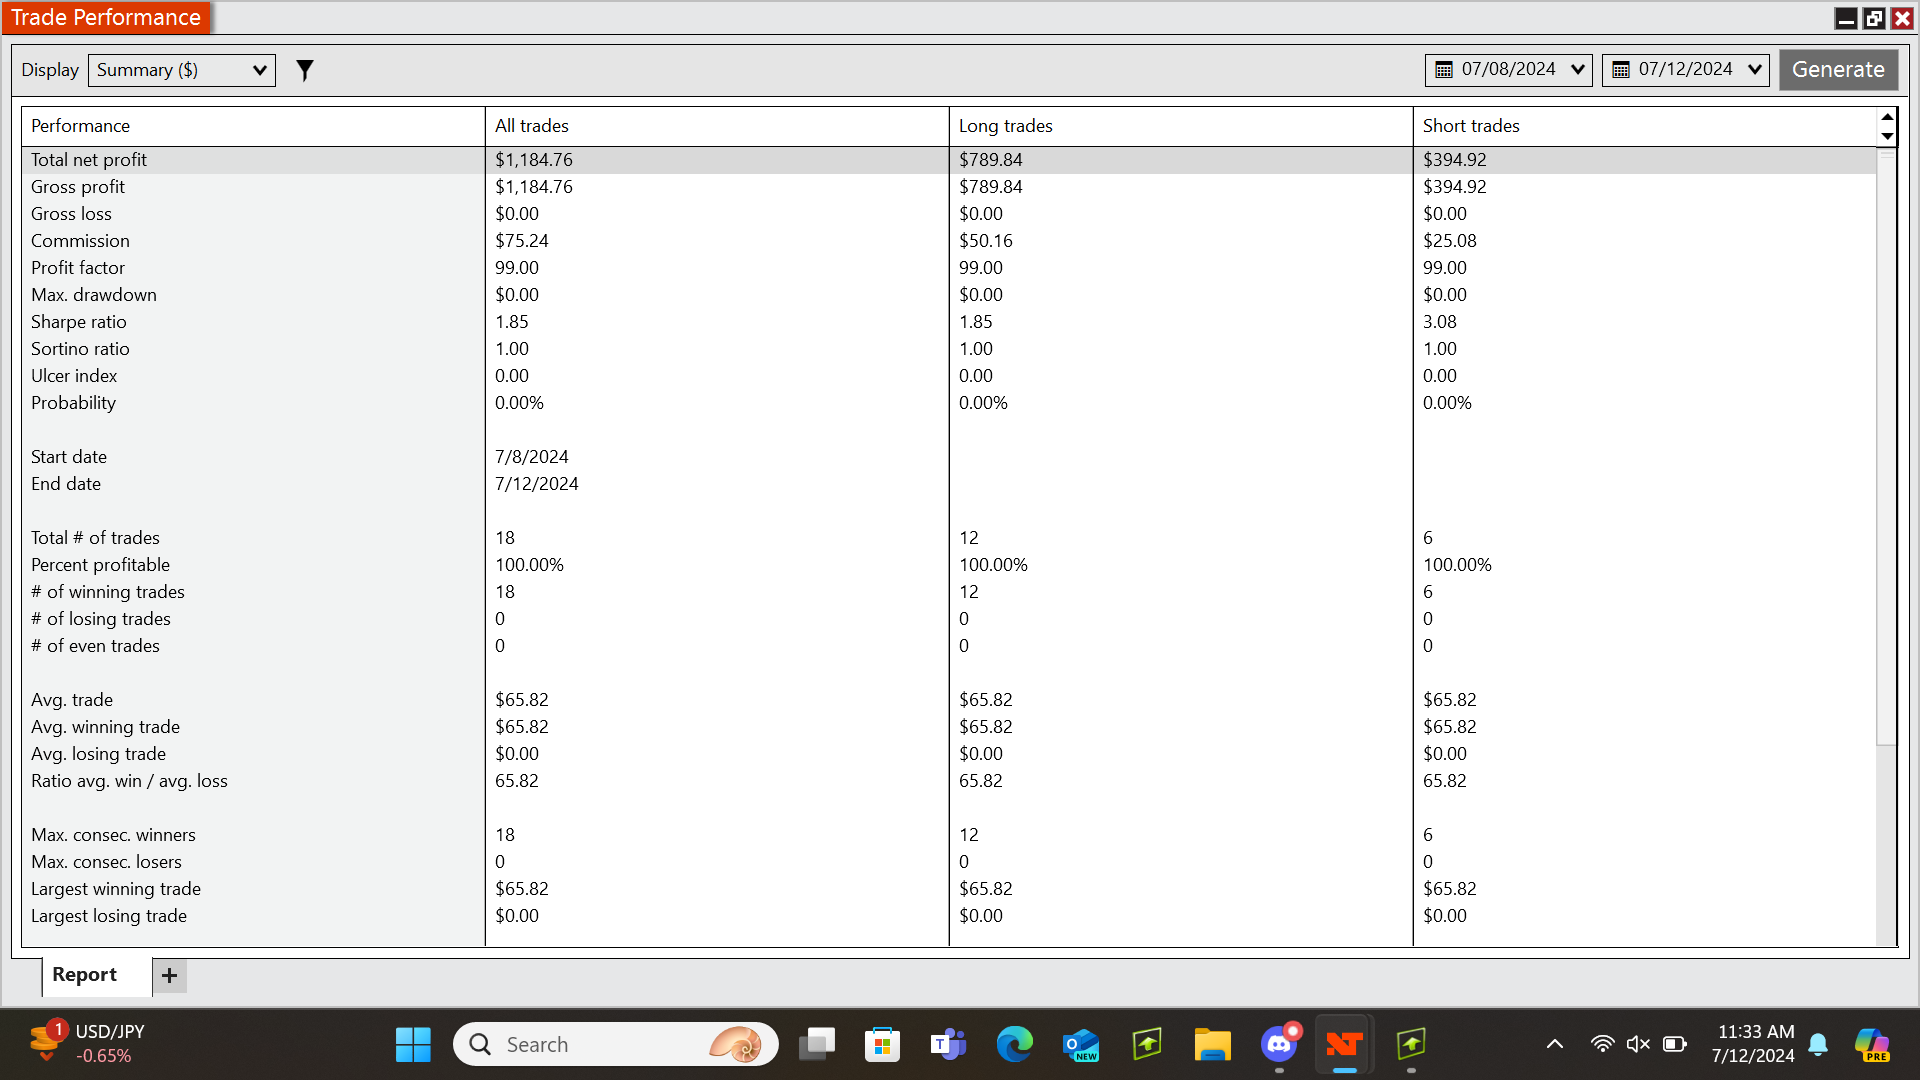
NinjaTrader 8 strategy unmanaged mode trade engine base foundation for futures, comprising of 4 bracket capacity, all in scale out - single entry position - multiple exits per trade operation, hybrid UI controls to allow semi/auto modes in trading the best of both worlds, open source with samples.
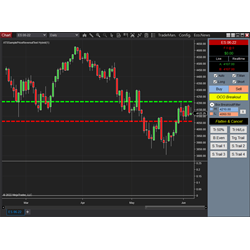
A semi-automated strategy that uses the previous days Fibonnaci range and an EMA to enter and exit trades.
By subscribing to our Indicator Spotlight traders get a free monthly download from the LizardIndicators indicator library. All indicator features are documented with an explanation on how the indicator can be used in a trading strategy. Sign up today!
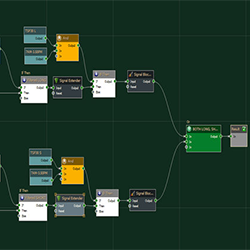
Custom strategy design in BloodHound. Remek! will program your trading strategy as per your specifications and requirements. Learn more!
Subscribe to their daily trade reports. Learn how to set up your news trades with their JOBB software, or create your own software set ups.
December 2, 2024
Mastering Sideways Markets With Auction Bars and Range Projections
November 19, 2024
Enhancing Your Automated Trading System: Key Insights from Best Pro Trade
November 14, 2024
NinjaTrader New Ecosystem Tools: October 2024 Edition
Enter Email for Updates