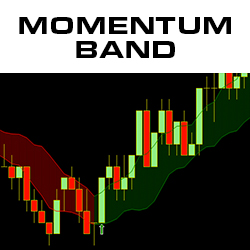
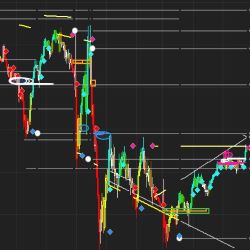
The Momentum Band indicator shows the trend and takes the noise out of the market, keeping you in trades longer, as you won’t get shaken out by temporary price fluctuations. Color changes and arrows indicate significant changes in momentum. Stay in Trades Longer & Download the Momentum Band Today!
Bell-VSA is designed to consolidate both fundamental and technical analysis into a solitary approach. The Bell-VSA features Volume Spread Analysis Signals, volume profile & customizable colors.
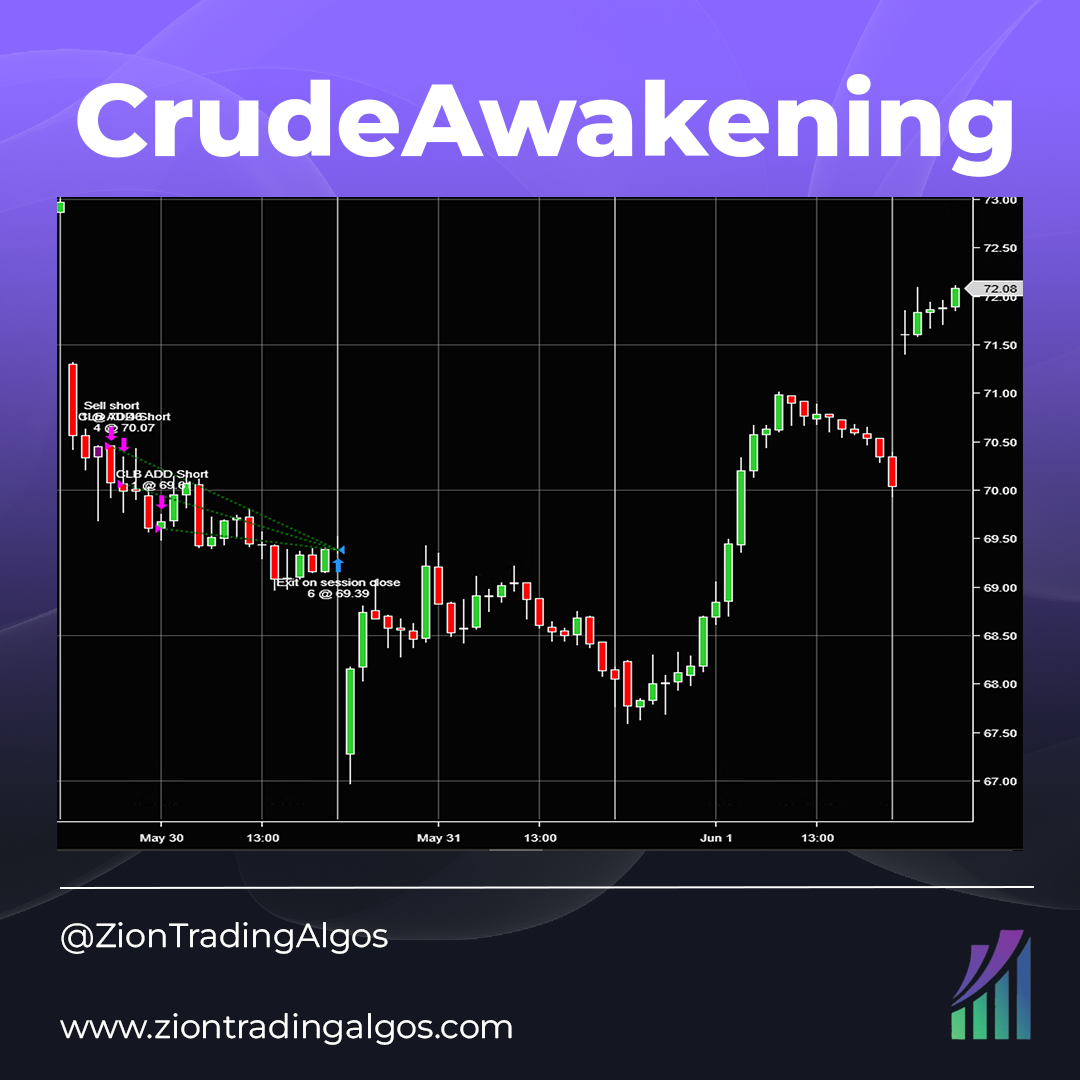
CrudeAwakening is an intraday CL system that trades on the 15-minute chart. It is a short only strategy.
Would you like to learn how to code your own strategies, indicators, bar types, optimization algorithms and amazing .NET extensions? This course, taught by Yuri Zolotarev, contains over 60 lectures and more than 5 hours of content. In addition, we are always updating this program with new material.
Support and Resistance (SR) are valuable tools in trading, but not all SR levels are created equal nor are they predictive. Finding the ideal SR Level is what Q Scalper effectively does. It shows you accurate profit target levels based on these significant levels. Learn more on the Quaderr website.
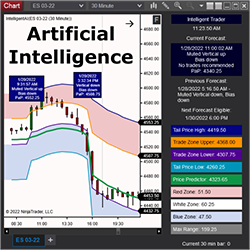
Intelligent AI uses a proprietary AIFS platform (Artificial Intelligence Forecast System). AIFS models are trained to learn the underlying structure of the market to forecast what may happen over the next six hours. Subscriptions also include access to Intelligent Trader's moderated Discord channel.
Learn from a certified Mental Performance Coach and Veteran Trader! Discover how to control that voice inside of you that causes you to chase trades, enter too early, revenge trade, fear of missing out (FOMO), over trade, under trade, and blow accounts. And the list goes on...
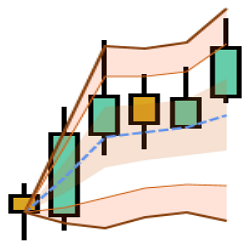
DrawCator VWAP is a feature-rich drawing tool which plots VWAP (+SD Bands) by mouse drag-n-draw on custom start & end points. New Attach and Roll modes provide auto updating and forwarding with live markets. Alerts, Ninjascripting, Strategy & Market Analyzer and 1-Click draw are all supported.
Every trader needs a list of quality "in play" stocks with the potential for consistent returns. The TR150 watchlist brings you that list each and every week through its unique technical, quantitative and fundamental growth selection criteria. Learn more here!
TradesViz is an advanced online trading journal. Auto-sync with NinjaTrader and Tradovate. It includes auto-plotted executions on charts and more than 300 statistics, including MFE, MAE, best-exit analysis and more! Auto-sync with brokers and discover your trading edge!
March 25, 2024
Trading Pullbacks and Reversals: Simplifying a Once Complex Retail Trading Strategy
March 21, 2024
VWAP Indicator: Average Price Shown Based on Price, Volume
March 18, 2024
Trade Copier Strategies: Make Efficiency Work for You When Futures Trading
Enter Email for Updates