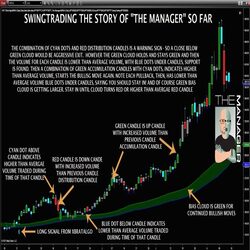
The Manager helps with simple and repeatable trade management. Using a number of tools like average volume, volume distribution or accumulation and an adjustable BIAS cloud, it can help you evaluate whether the market is reversing or just pulling back.
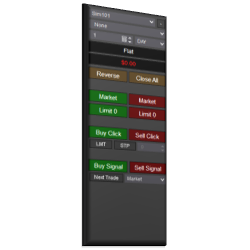
The Signal Entry Orders indicator allows traders to click a button that initiates logic to submit orders immediately on the close of a bar, as soon as a signal occurs. This removes unnecessary stress and challenge on entering orders.
Don’t let someone else trade your idea first! We know it’s frustrating to have a great idea but not the knowledge to code it. That’s why we, a certified vendor of NinjaTrader, and our team of developers (who have 17 years of coding experience) have helped hundreds of customers. Reach out to us!
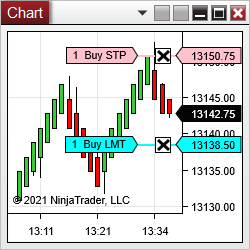
Download this free indicator that allows you to trade directly on your chart. You no longer need to use buttons to enter the market. With this indicator, you can select your entry point directly on the chart. Quickly place limit orders with a single click of the mouse (no need to right-click).
Clicker allows one to enter orders with one click directly on the chart! Modifier keys and mouse buttons for buying and selling are configurable. The order type is detected from the clicked price relative to the market price. All order parameters come from ChartTrader. Free trial for seven days.
This model tracks a universe of approximately 30 equities from industries related to green transportation. This includes suppliers and manufacturers of components, batteries, fuel cells, sensors, autonomous vehicles, power trains, etc. Contact Alpha Vee for more information.
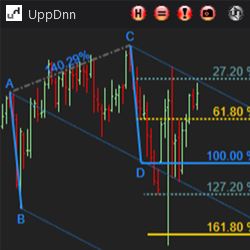
The Symmetry Drawing Tool helps quickly analyze symmetrical market movements by simply drawing a line from point A to point C. Add Fibonacci levels, customize appearance, add Andrew's Pitchfork with customizable levels and output a potential reversal area based on swing pattern logic!
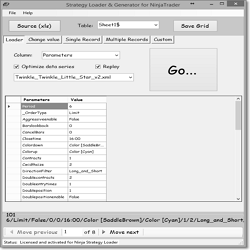
The Ninja Strategy Generator allows traders to make changes to the Parameters record that exports from NinjaTrader to create new strategies with slight variations of the strategy you wish to optimize.
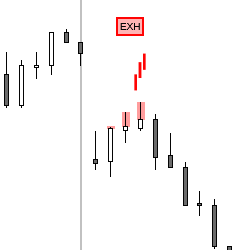
This indicator is a new approach to Price Action trading. It identifies momentum and exhaustion by examining bar features and relation to prior bars in great detail. It can be used as a discretionary indicator or for automated (e.g. BloodHound) trading. Get started with a free 20-day trial today!
Creating custom algorithmic trading solutions that provide out of the box edge.
December 2, 2024
Mastering Sideways Markets With Auction Bars and Range Projections
November 19, 2024
Enhancing Your Automated Trading System: Key Insights from Best Pro Trade
November 14, 2024
NinjaTrader New Ecosystem Tools: October 2024 Edition
Enter Email for Updates