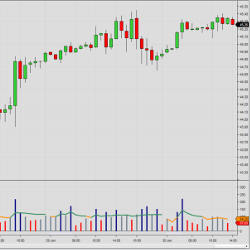
The Relative Volume indicator identifies high/low volume bars by comparing current volume against the average volume over the same period during the preceding days/weeks.
What a lovely day yesterday was! Do you ever wonder if there were similar days in the history of a trading instrument, and what happened thereafter? With the Similar Days Project, view price scenarios for 24 different currency pairs. This technology is scalable on any market.
Need a custom indicator, tool or strategy? Integrity-Traders offers a NinjaScript development service aimed at creating tools and indicators with a polished look and feel, precise operation and well documented parameters descriptions. Contact Integrity-Traders today!
This ES S&P Day trading course uses Fibonacci technical analysis to identify entry and exit strategies. Rose has backtested for many years to determine the optimal Fibonacci Retracement and Extension levels for a consistent system. Get started with a free consultation with Rose!
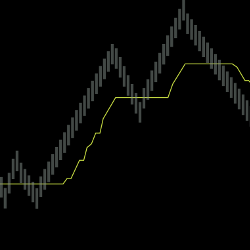
The LogikUltimateRenko is a completely customizable improved variant of the traditional Renko bar type. It has the added options to set the Open Price Relation (to the prior bar), as well as a more precise Reversal Brick Size control. Check out a video demonstration of LogikUltimateRenko in action!
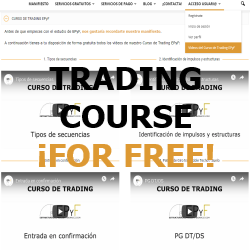
Do you want to know the trading setups we use? Create your own profile FREE on our website and you’ll have access to our course videos where we explain each of our patterns. Gain the knowledge to access our EPyF Trading Room and learn our way of understanding the market.
Nordman Algorithms provides indicator and strategy programming services. Indicators for trend identification, trade zone detection, news impact calculation, price pattern visualization & more can be built, as well as extendable, maintainable systems that follow your trade strategy.
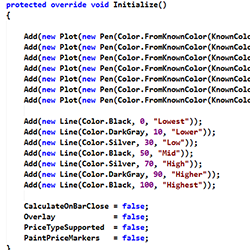
This trading indicator is the ultimate “go/no-go gauge” for any trading strategy. A sub-chart that looks up six timeframes and gives real-time BIAS. Bullish, neutral or bearish on each level. Making decisions and acting on trading signals made easier!
Highly customizable indicator allowing traders to track volatility without spending time staring at a screen. Candlesticks are represented by different custom colors depending on the direction of price movement & its amplitude. Notifications are also sent via email, text or by your favorite sound.
Larry Cheung’s investment community provides investment research regarding U.S and Chinese macroeconomics and company-specific fundamental analysis. He also uses technical analysis and order flow to best understand risk/reward for entries and exits across different timeframes.
December 2, 2024
Mastering Sideways Markets With Auction Bars and Range Projections
November 19, 2024
Enhancing Your Automated Trading System: Key Insights from Best Pro Trade
November 14, 2024
NinjaTrader New Ecosystem Tools: October 2024 Edition
Enter Email for Updates