Market Analyzer Column: Effortlessly tailor real-time market data to your needs.
Kwikpop 6 brings the trend of any market into clear view utilizing a combination of 26 proprietary indicators to find potential entries and exits. The Dynamic Power Tools are designed to remove the noise from charts and clearly show the trend.
Custom Development Services are tailored for NinjaTrader users, offering bespoke solutions across markets. They provide real-time cryptocurrency data integration, custom indicators, strategies, and add-ons to optimize trading performance and profitability.
Storm Eye enhances trading accuracy by leveraging fake breakouts to pinpoint optimal entry points, offering a sophisticated and reliable method for navigating market turbulence. It operates through a three-step process: Identifying a breakout, detecting a breakaway, and generating a signal.
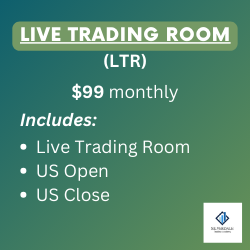
Join this team of professional traders and mentors as they identify trades in real time (US / open & close NQ & ES).
No subchart indicators or additional time frame charts are required to see when price becomes overbought or oversold. This helps the trader identify weakness in an uptrend or strength in a downtrend to anticipate a potential change in price direction. An award winning "heads-up display" indicator!
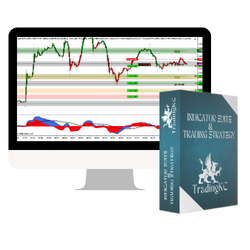
Simplify your trading with my strategy: trend, price action, support/resistance and momentum. Green/red bars indicate trend, custom ExCon indicator manages setups, pivots show support/resistance and MACD ties it all together. Clear entries, take profits and exits with simple rules for engagement.
Trade with the best conditions in order to become an extraordinary trader, follow the risk management rules and reach your target in as little as 10 days. Once you have completed the target, we will connect you with one of our funding partners.
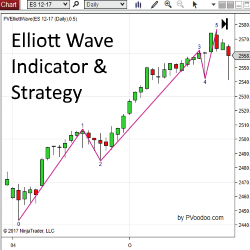
PVElliottWave Indicator is an Elliott Wave indicator designed for the NinjaTrader platform. Get started with a free trial of this indicator now!
A unique course with a specific, rule-based & mechanical/objective trading methodology. Designed to help traders identify entries & exits, define size, manage risk and control emotions when trading Equity Markets with their own characteristics & terminology. Get FREE access to the patented AutoUFOs®
December 2, 2024
Mastering Sideways Markets With Auction Bars and Range Projections
November 19, 2024
Enhancing Your Automated Trading System: Key Insights from Best Pro Trade
November 14, 2024
NinjaTrader New Ecosystem Tools: October 2024 Edition
Enter Email for Updates